12Mar

Texas Instruments (TXN) Stock Ready for a Breakout? TXN Elliott Wave Technical Analysis Reveals Key Levels and Price Trends!

Texas Instruments Inc. (TXN) Elliott Wave Analysis - TradingLounge Daily Chart

TXN Daily Chart – Elliott Wave Technical Analysis
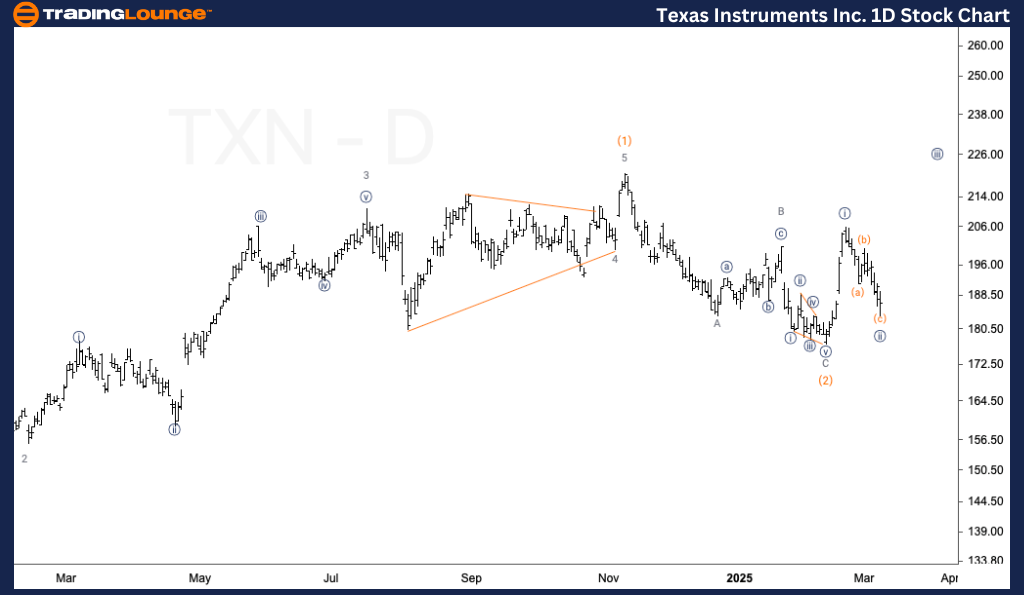
Function: Trend

Mode: Impulsive

Structure: Motive

Position: Wave {ii} of 1

Direction: Possible bottom in wave {ii}

Texas Instruments Inc Stock Analysis Details:
Texas Instruments Inc. (TXN) appears to have formed a key bottom in wave (2). However, if the stock price continues declining, there is an increasing probability of a double correction in Intermediate wave (2). If this bottom holds, the next move is likely an upside rally, aligning with the Elliott Wave principle's trend-following behavior.

Texas-Instruments-In...


Texas Instruments Inc 1-Hour Chart Analysis

TXN – Elliott Wave Technical Analysis
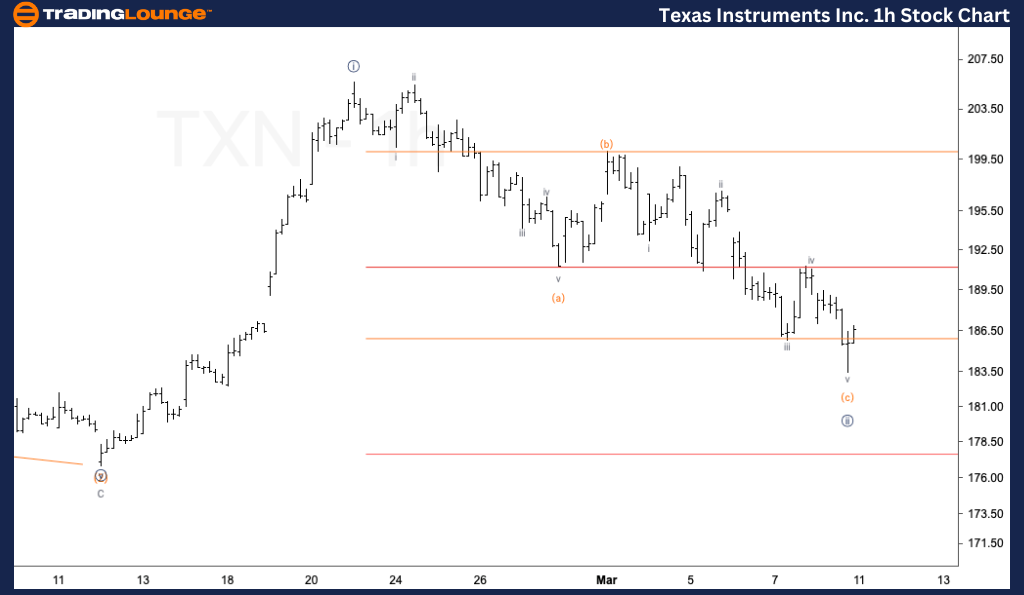
Function: Trend

Mode: Impulsive

Structure: Motive

Position: Wave (c) of {ii}

Direction: Downside in wave (c)

Analysis Details:

On the 1-hour chart, TXN is showing potential signs of forming a bottom as wave (c) nears completion. The five-wave count in wave (c) aligns with the wave (c) = wave (a) ratio, suggesting wave {ii} is close to ending. If price action confirms a reversal, an upward move may follow, marking the beginning of a new bullish cycle.

Technical Analyst: Malik Awais

Source: Visit Tradinglounge.com and learn from the Experts. Join TradingLounge Here 

Previous: Walmart Inc Elliott Wave Technical Analysis

VALUE Offer - Buy 1 Month & Get 3 Months!Click here

Access 7 Analysts Over 200 Markets Covered. Chat Room With Support

Texas-Instruments-In...


Conclusion:

This Elliott Wave analysis of Texas Instruments (TXN) evaluates both daily and 1-hour charts to identify key trend developments. The daily chart suggests wave {ii} may have reached a significant bottom, though a double correction remains possible if downward momentum persists. The 1-hour chart further supports this outlook by indicating wave (c) completion, aligning with anticipated price movements.

Traders should monitor price action closely for confirmation of an upside move before entering new positions. Staying aligned with Elliott Wave principles can help navigate market trends effectively.
 

Related

KOSPI Composite Index Elliott Wave Analysis: Detailed Daily and Weekly Insights into Bullish Trends, Market Predictions

KOSPI Composite Index Elliott Wave Analysis: Detailed Daily and Weekly Insights into Bullish Trends, Market Predictions

KOSPI Composite Index Elliott Wave Analysis, highlighting bullish trends on daily and weekly charts....

Read More >
BANKS, AAPL, AMZN, NVDA, TSLA, GOOGL, META, NFLX, MSFT. Elliott Wave Insights & Strategies

BANKS, AAPL, AMZN, NVDA, TSLA, GOOGL, META, NFLX, MSFT. Elliott Wave Insights & Strategies

Nvidia and Meta Platforms will top in Primary Wave 1) in March 2024. They have a good few months for...

Read More >
TITAN COMPANY Stock Elliott Wave Technical Analysis: Stock Currently Progressing within a Corrective Wave Structure

TITAN COMPANY Stock Elliott Wave Technical Analysis: Stock Currently Progressing within a Corrective Wave Structure

This article provides an in-depth Elliott Wave analysis of TITAN Company stock, including detailed f...

Read More >
Dogecoin (DOGEUSD) Elliott Wave Analysis, Price Prediction, Trading Strategy, Support & Resistance Levels, and Crypto Market Trends

Dogecoin (DOGEUSD) Elliott Wave Analysis, Price Prediction, Trading Strategy, Support & Resistance Levels, and Crypto Market Trends

Elliott Wave Analysis for Dogecoin (DOGEUSD), outlining key technical analysis insights and trading ...

Read More >
Adani Enterprises Elliott Wave Analysis: Technical Insights, Price Predictions, and Chart Analysis for Informed Trading Decisions

Adani Enterprises Elliott Wave Analysis: Technical Insights, Price Predictions, and Chart Analysis for Informed Trading Decisions

A comprehensive Elliott Wave analysis of Adani Enterprises discovers insights into the stock's c...

Read More >
 Iron Ore Commodity Elliott Wave Technical Analysis: Bullish Impulse Set to Resume

Iron Ore Commodity Elliott Wave Technical Analysis: Bullish Impulse Set to Resume

In the realm of iron ore trading, as of February 22, 2024, Elliott Wave analysis reveals a potential...

Read More >

Buy 1 Month

Get 3 Months!

Special Offer:

Trade Recommendations

Unleash the power of deversified trading with our comprehensive portfolio, covering:

  • Stock Trades
  • Crypto Trades
  • Forex Trades
  • Commodity Trades
Elliott Wave Analysis

Gain a competive edge with expert insights in to:

  • Global Indices
  • US Stocks & ASX Stocks
  • Forex & Crypto
  • Commodities
Top-Notch Trading Tools

Equip yourself with the tools of success:

  • Social Chat
  • Elliott Wave Algorithm
  • Screener
  • TradingLevels
  • Trading Game
7 Elliott Wave Analysts

Stay ahead of the market with daily charts and insightful videos
-Your secret to strategic trading!

JOIN HERE


Welcome to TradingLounge (ASIC A.R.No. 321187), specialists in trades, trading education and technical analysis, covering stocks, indices, commodities, forex and cryptocurrencies.

When you join TradingLounge you have access to everything we offer, including trade tools, educational content and a social platform to chat with like-minded investors.

Read more

@Copyright 2024 by tradinglounge.com

Contact Us

Australian no: 02 4787 6020

International no: +61 (2) 47876020

Pay with:

Find us on