Walmart Inc. (WMT) – Elliott Wave Analysis (Daily Chart)
WMT Elliott Wave Technical Analysis
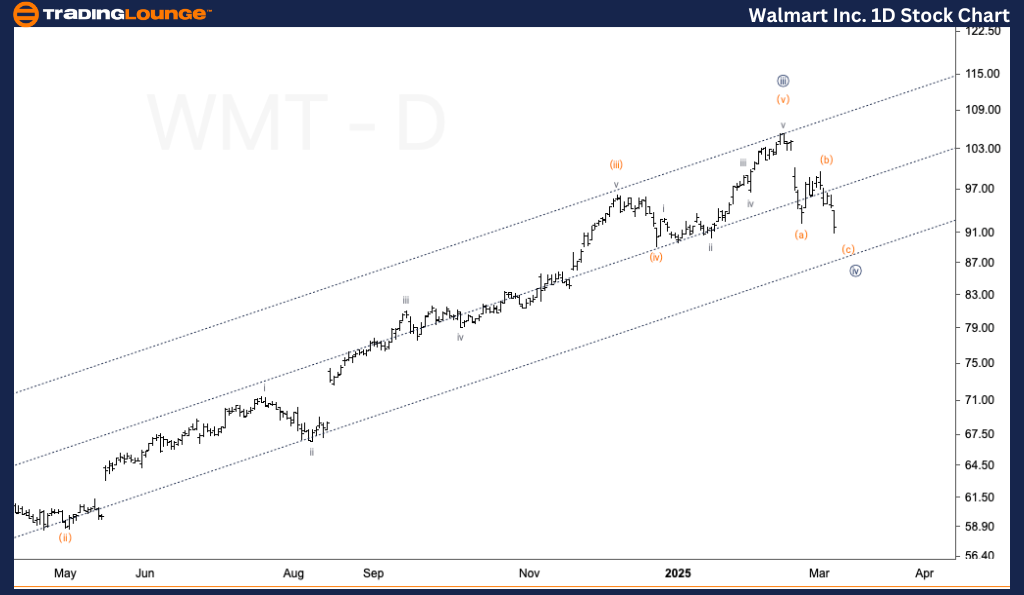
Function: Counter-Trend
Mode: Corrective
Structure: ZigZag
Position: Minute Wave {iv}
Direction: Bottom in wave {iv}
Details:
Walmart Inc. (WMT) is currently in the final phase of a corrective Minute Wave {iv}, forming a ZigZag pattern. The stock is approaching a potential bottom near $88, where it is expected to bounce off the lower boundary of a temporary parallel channel. If this scenario materializes, it could confirm the completion of wave {iv}, indicating a possible trend reversal and the continuation of the broader upward movement.
Walmart Inc. (WMT) – Elliott Wave Analysis (1H Chart)
WMT Elliott Wave Technical Analysis
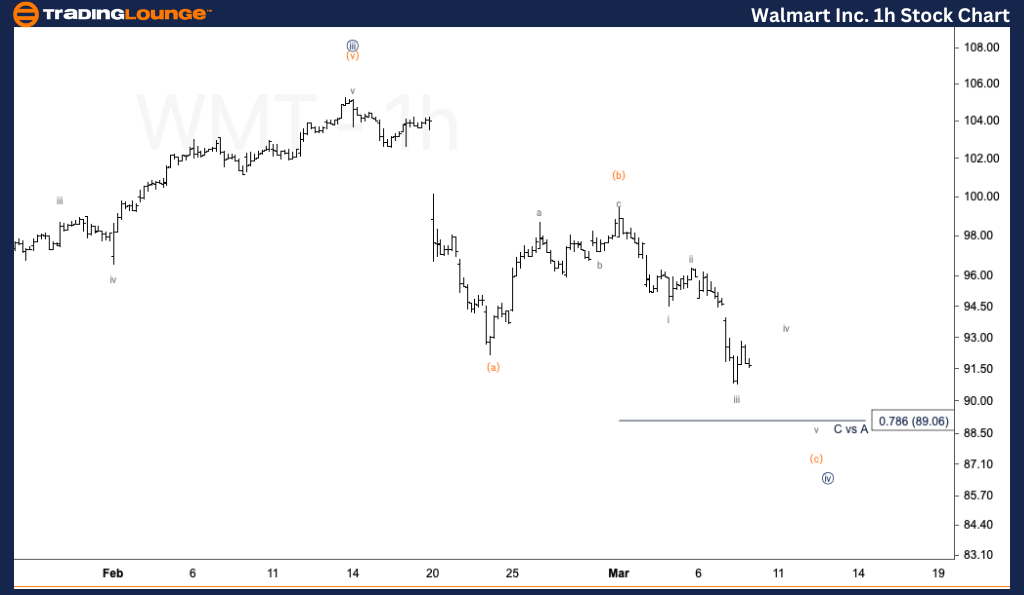
Function: Counter-Trend
Mode: Corrective
Structure: ZigZag
Position: Minute Wave {iv}
Direction: Bottom in wave {iv}
Details:
On the 1-hour chart, WMT’s corrective wave (c) of Minute Wave {iv} suggests further downside movement before reaching a confirmed bottom. The internal subdivisions of wave (c) indicate that an additional decline is needed to complete the correction, aligning with the anticipated support zone near $88. If this level holds, the stock could enter Wave {v}, signaling a potential bullish reversal.
Technical Analyst: Malik Awais
Source: visit Tradinglounge.com and learn From the Experts Join TradingLounge Here
Previous: McDonald's Corp. (MCD) Elliott Wave Technical Analysis
VALUE Offer - Buy 1 Month & Get 3 Months!Click here
Access 7 Analysts Over 200 Markets Covered. Chat Room With Support
Elliott Wave Forecast for Walmart (WMT)
This Elliott Wave Analysis evaluates both daily and 1-hour charts to identify key market trends and predict WMT's future price movements based on Elliott Wave Theory. Investors should watch for potential support near $88, which could serve as a key reversal zone, confirming the end of Wave {iv} and a shift towards the next bullish phase.