McDonald's Corp. (MCD) Elliott Wave Analysis – Trading Lounge Daily Chart
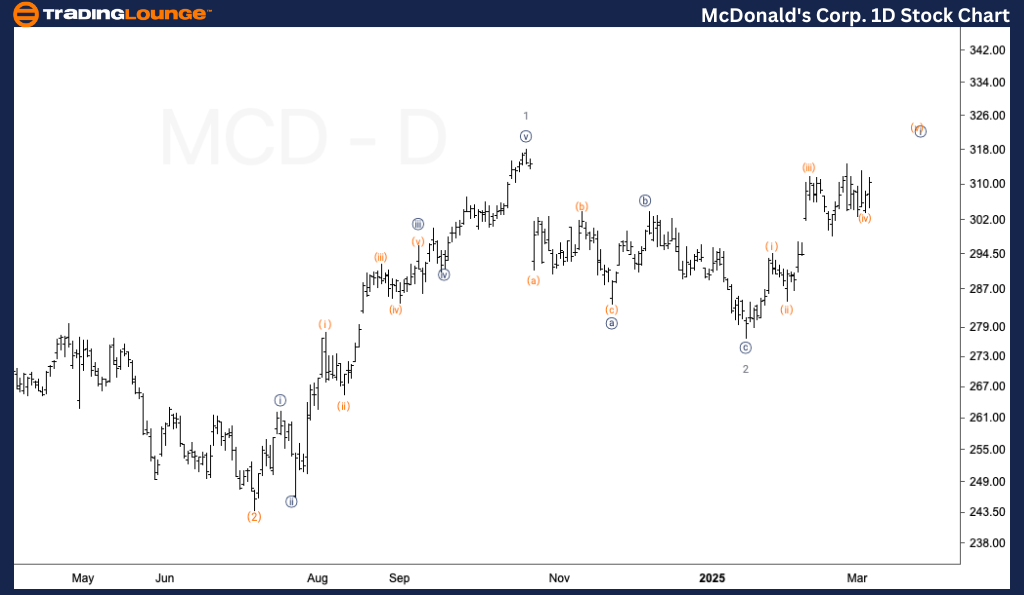
MCD Elliott Wave Technical Analysis – Daily Chart
Function: Trend
Mode: Impulsive
Structure: Motive
Position: Wave 3 of (3)
Direction: Upside within Wave 3
Details:
The long-term Elliott Wave outlook for McDonald's (MCD) stock remains bullish, with confirmation expected once the price sustains levels above $300. A Wave {ii} of 3 pullback is anticipated near the previous all-time high (ATH), presenting a potential buying opportunity before the next upward movement.
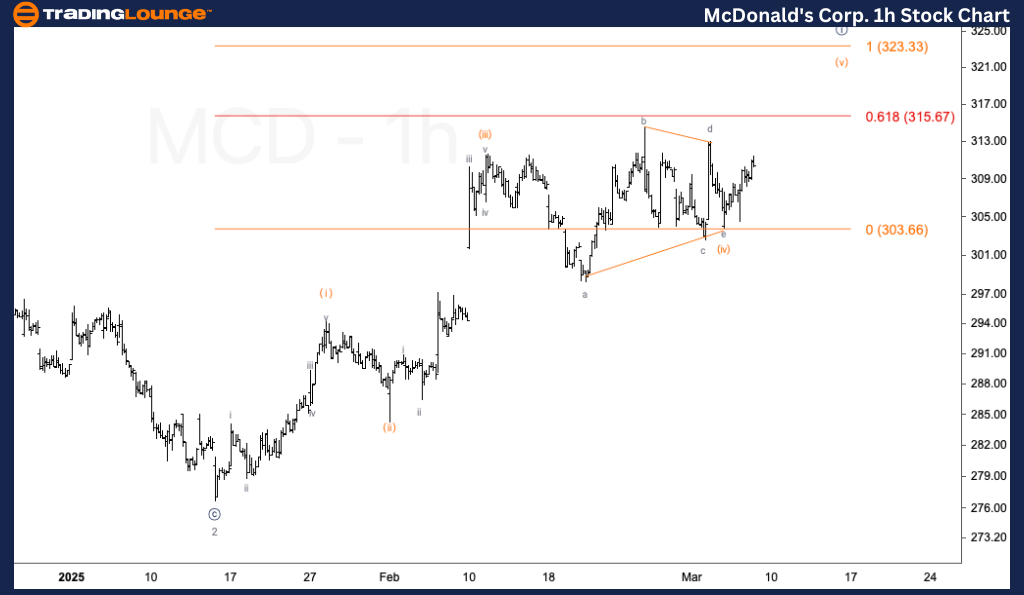
MCD Elliott Wave Technical Analysis – 1H Chart
Function: Trend
Mode: Impulsive
Structure: Motive
Position: Wave (v) of {i}
Direction: Upside within Wave (v)
Details:
The 1-hour chart analysis indicates Wave (iv) as a triangle correction, with a potential bottom already formed. If this structure holds, an upside move within Wave (v) is expected.
The Wave (v) target is approximately $323, aligning with Wave (v) equaling Wave (i). This level may complete Wave {i}, followed by a minor corrective pullback, offering a trading opportunity for investors tracking Elliott Wave patterns.
Technical Analyst: Malik Awais
Source: visit Tradinglounge.com and learn From the Experts Join TradingLounge Here
Previous: LULU Elliott Wave Technical Analysis
VALUE Offer - Buy 1 Month & Get 3 Months!Click here
Access 7 Analysts Over 200 Markets Covered. Chat Room With Support