20May

Texas Instruments Inc. (TXN) Elliott Wave Analysis Highlights Bullish 1H Chart and Flat Correction Structure with Key $200 Resistance Level

TXN Elliott Wave Analysis | Texas Instruments Stock Forecast

In this Elliott Wave analysis for Texas Instruments Inc. (TXN), both daily and hourly chart setups provide detailed insights into the ongoing technical structure and potential future price movement of TXN stock.


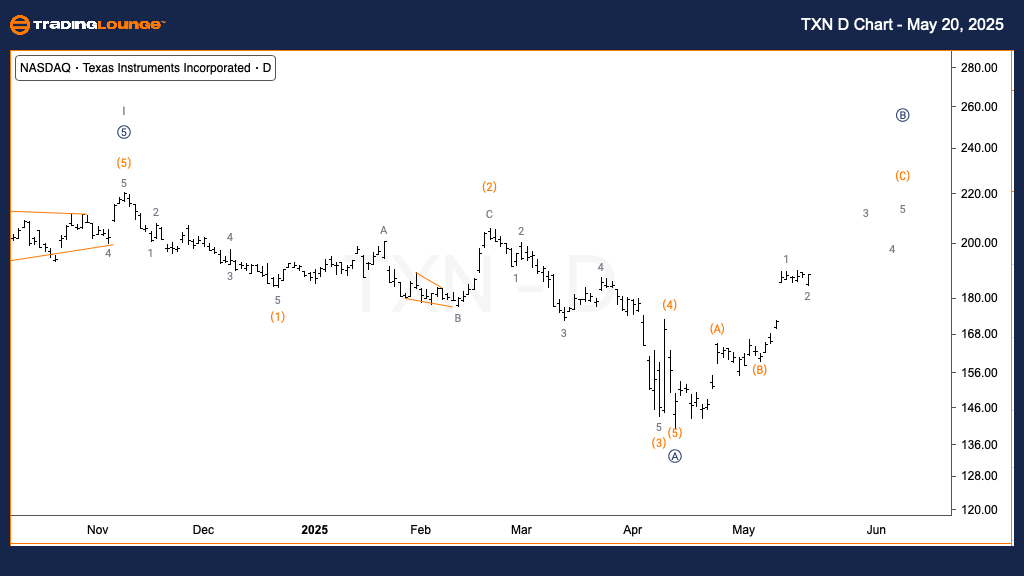
Texas Instruments Inc. (TXN)  Elliott Wave Analysis – Trading Lounge Daily Chart

TXN Stock Elliott Wave Forecast – Daily Timeframe

FUNCTION: Counter Trend

MODE: Corrective

STRUCTURE: Flat Correction

POSITION: Wave (C) of B

DIRECTION: Uptrend in Wave (C)

DETAILS: This analysis indicates a bearish corrective structure. A completed three-wave decline formed Primary wave A, followed by an upward correction developing as Primary wave B.

Texas Instruments Elliott Wave Analysis – Daily Chart Insights

The daily chart of TXN stock reveals a corrective Elliott Wave pattern. After a downward three-leg sequence forming Primary wave A, Texas Instruments stock is now entering Primary wave B. This corrective phase progresses upward through Intermediate wave (C), consistent with a flat wave structure in Elliott terms.

TXN-d-us-chart-20052...


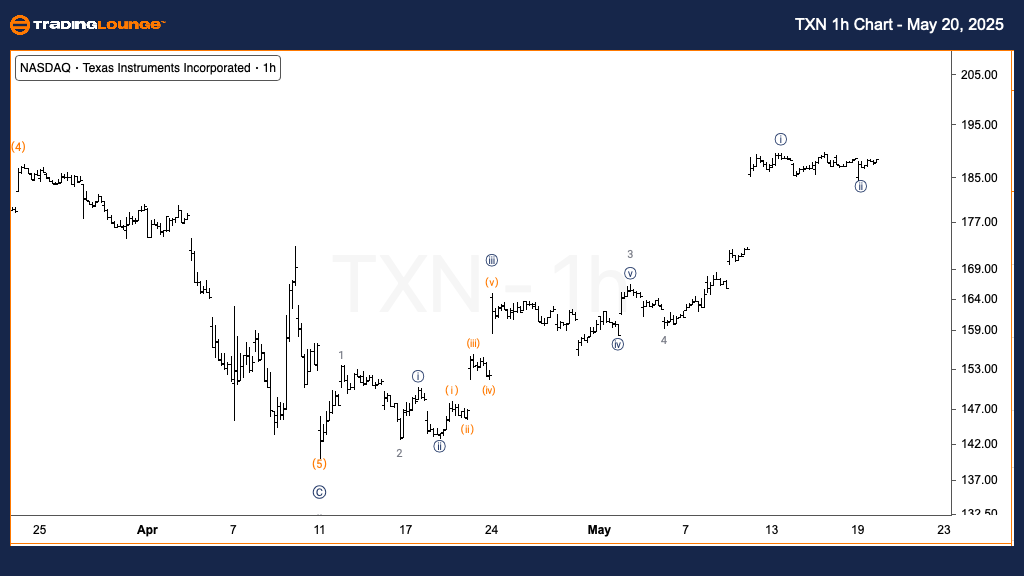
Texas Instruments Inc. (TXN)  Elliott Wave Analysis – Trading Lounge 1-Hour Chart

TXN Stock Elliott Wave Forecast – 1H Timeframe

FUNCTION: Trend

MODE: Impulsive

STRUCTURE: Motive Wave

POSITION: Wave {iii} of 5

DIRECTION: Uptrend in Wave {iii}

DETAILS: The bullish structure identifies an active Minor wave 5. Currently, price action is within wave {iii}, pushing toward a key resistance near $200 (Trading Level 2).

Texas Instruments Elliott Wave Analysis – 1-Hour Chart Highlights

The 1-hour chart suggests a bullish outlook for TXN. Minor wave 5 continues to evolve, with wave {iii} propelling the price upward. Traders and investors should closely monitor the $200 level, marked as TradingLevel2, as it may present a potential resistance zone in the short term.

Technical Analyst: Alessio Barretta

Source: Visit Tradinglounge.com and learn from the Experts. Join TradingLounge Here 

Previous: Mastercard Inc. (MA) Elliott Wave Technical Analysis

VALUE Offer - Buy 1 Month & Get 3 Months!Click here

Access 7 Analysts Over 200 Markets Covered. Chat Room With Support


TXN-1h-us-chart-2005...


Exclusive TradingLounge Offer: $1 Two-Week Trial, then $29 Per Month -  58% Discount NOW

Access 8 analysts, 250+ markets, real-time chat rooms, AI-powered Elliott Wave charting, and portfolio tools.

Claim This Deal Now


Related

Bitcoin/ U.S. dollar(BTCUSD) Elliott Wave Technical Analysis 5 December 23

Bitcoin/ U.S. dollar(BTCUSD) Elliott Wave Technical Analysis 5 December 23

Bitcoin/U.S. dollar(BTCUSD) Elliott Wave Technical Analysis dated 5 December 23 with BTCUSD Analysis...

Read More >
Navigating Markets: Weekly Forex, Crypto, Stocks Insights & Trade Opportunities (5th-9th February 2024)

Navigating Markets: Weekly Forex, Crypto, Stocks Insights & Trade Opportunities (5th-9th February 2024)

Explore our Weekly Elliott Wave Analysis Report (5th-9th February 2024) for expert insights and trad...

Read More >
AAPL Stock Analysis: Apple Inc.(AAPL) Elliott Wave Technical Analysis, Stock price predictions, and news updates.

AAPL Stock Analysis: Apple Inc.(AAPL) Elliott Wave Technical Analysis, Stock price predictions, and news updates.

Apple Inc. (AAPL) Elliott Wave Technical Analysis 5 March 24, Explore the latest AAPL stock analysis...

Read More >
The Home Depot (HD) Stocks Elliott Wave Technical Analysis: Bearish Trend and Trading Opportunities

The Home Depot (HD) Stocks Elliott Wave Technical Analysis: Bearish Trend and Trading Opportunities

Discover the latest Elliott Wave analysis for The Home Depot (HD), highlighting bearish trends and t...

Read More >
in-depth Analysis and Trading Strategies S&P/ASX 200 Indices Elliott Wave Technical Analysis

in-depth Analysis and Trading Strategies S&P/ASX 200 Indices Elliott Wave Technical Analysis

Stay ahead in the S&P/ASX 200 market with our in-depth analysis and trading strategies. Our comprehe...

Read More >
Gain expert insights into Dogecoin's market Crypto Price: DOGEUSD Elliott Wave Technical Analysis

Gain expert insights into Dogecoin's market Crypto Price: DOGEUSD Elliott Wave Technical Analysis

trends with our comprehensive Elliott Wave analysis. Learn about DOGEUSD technical analysis, trading...

Read More >

Buy 1 Month

Get 3 Months!

Special Offer:

Trade Recommendations

Unleash the power of deversified trading with our comprehensive portfolio, covering:

  • Stock Trades
  • Crypto Trades
  • Forex Trades
  • Commodity Trades
Elliott Wave Analysis

Gain a competive edge with expert insights in to:

  • Global Indices
  • US Stocks & ASX Stocks
  • Forex & Crypto
  • Commodities
Top-Notch Trading Tools

Equip yourself with the tools of success:

  • Social Chat
  • Elliott Wave Algorithm
  • Screener
  • TradingLevels
  • Trading Game
7 Elliott Wave Analysts

Stay ahead of the market with daily charts and insightful videos
-Your secret to strategic trading!

JOIN HERE


Welcome to TradingLounge (ASIC A.R.No. 321187), specialists in trades, trading education and technical analysis, covering stocks, indices, commodities, forex and cryptocurrencies.

When you join TradingLounge you have access to everything we offer, including trade tools, educational content and a social platform to chat with like-minded investors.

Read more

@Copyright 2024 by tradinglounge.com

Contact Us

Australian no: 02 4787 6020

International no: +61 (2) 47876020

Pay with:

Find us on