13Jun

ADANI GREEN Elliott Wave Counter-Trend Analysis Reveals Wave 5 Impulse & Price Forecast – Invalidation Level 1592 Key

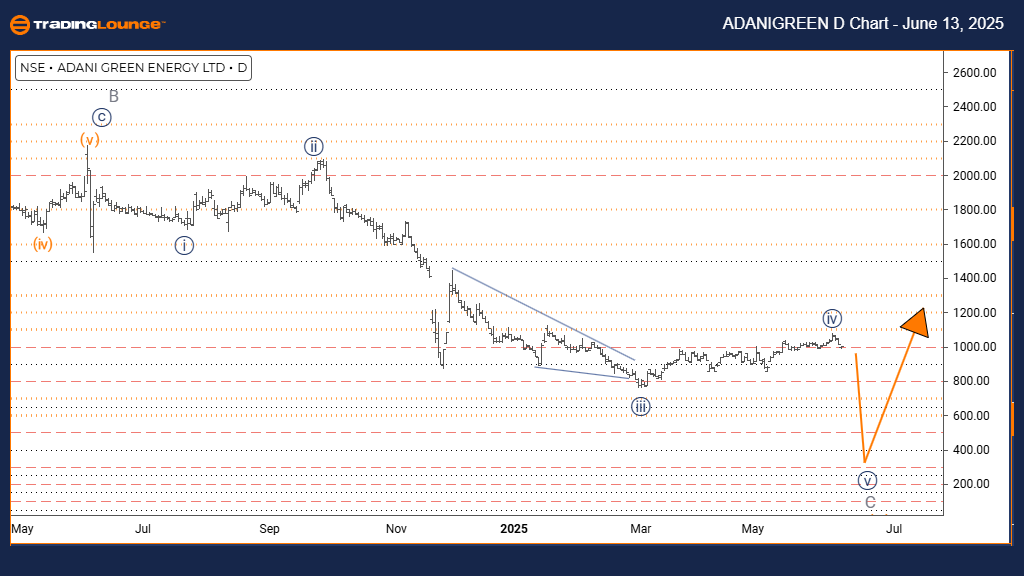
ADANI GREEN Elliott Wave Analysis - Trading Lounge Day Chart

ADANI GREEN Elliott Wave Technical Analysis

FUNCTION: Counter Trend

MODE: Impulsive

STRUCTURE: Navy blue wave 5

POSITION: Gray wave C

DIRECTION NEXT LOWER DEGREES: Navy blue wave 5 (in progress)

DETAILS: Navy blue wave 4 appears complete, initiating navy blue wave 5

Wave Cancel Invalid Level: 1592

The daily Elliott Wave forecast for ADANI GREEN reflects a counter-trend move developing within an impulsive pattern. This suggests strong price action is underway against the broader market direction. The wave structure currently outlines navy blue wave 5, located within a larger corrective pattern marked as gray wave C. This scenario indicates that the stock may be in the final stage of the correction.

Wave analysis supports that navy blue wave 4 has likely ended, and price action is transitioning into navy blue wave 5. This leg generally represents the last move in a counter-trend sequence and often brings swift price movement counter to the dominant trend. The progression of navy blue wave 5 has already started based on current wave counts.

Traders should track the critical invalidation level at 1592. A price move exceeding this level would invalidate the current Elliott Wave setup and call for a new technical outlook. Unless breached, the existing analysis continues to endorse the counter-trend scenario.

From a technical standpoint, ADANI GREEN appears positioned for a final counter-trend phase, confirming the end of wave 4. This suggests rising downside pressure, but market participants should stay alert for any reversal signals as navy blue wave 5 completes the broader corrective structure of gray wave C.

ADANIGREEN-d-indian-...


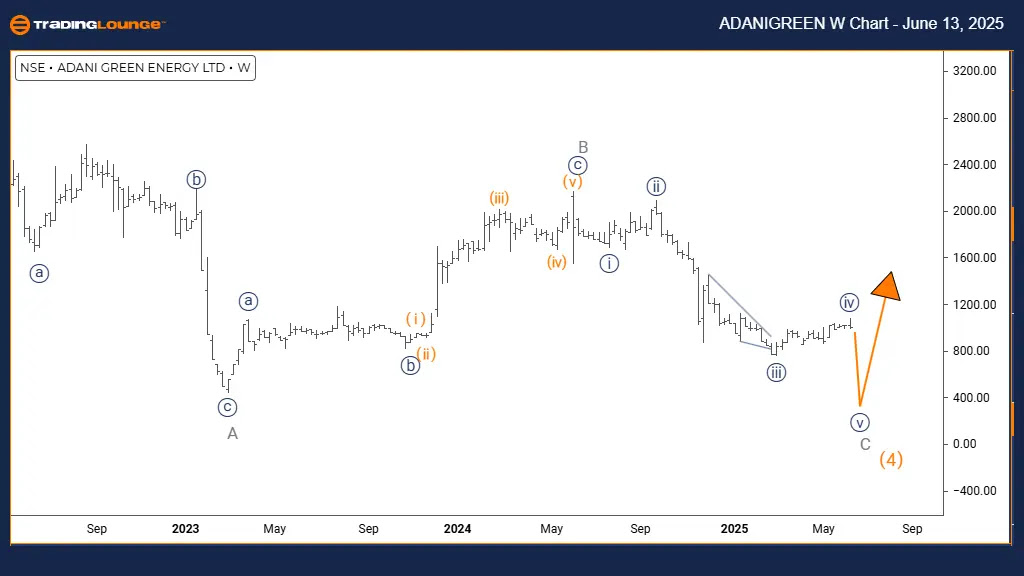
ADANI GREEN Elliott Wave Analysis - Trading Lounge Weekly Chart

ADANI GREEN Elliott Wave Technical Analysis

FUNCTION: Counter Trend

MODE: Impulsive

STRUCTURE: Gray wave C

POSITION: Orange wave 4

DIRECTION NEXT HIGHER DEGREES: Orange wave 5

DETAILS: Gray wave B appears complete, initiating gray wave C

Wave Cancel Invalid Level: 1592

The weekly Elliott Wave analysis for ADANI GREEN illustrates a counter-trend formation within an impulsive structure, signaling sustained movement against the major market trend. The active wave count, gray wave C, is part of a longer correction inside orange wave 4, indicating that the stock may be nearing the end of this phase.

With gray wave B concluded, the market has likely entered gray wave C — typically the final segment in a corrective pattern. This move often shows enhanced momentum opposite to the primary trend. Following its completion, orange wave 5 is anticipated, pointing to a possible resumption of the main trend.

The crucial level to monitor is the invalidation point at 1592. A move beyond this figure would break the current Elliott Wave pattern and require an updated market perspective. Until then, the existing chart formation continues to support the ongoing counter-trend thesis.

Presently, ADANI GREEN appears in the concluding stages of its correction, with gray wave C actively unfolding after gray wave B. This wave's impulsive behavior implies strong selling activity, but it is essential for traders to remain watchful for clues signaling the correction's end under orange wave 4.

Technical Analyst: Malik Awais

Source: Visit Tradinglounge.com and learn from the Experts. Join TradingLounge Here 

Previous: JSW STEEL Elliott Wave Technical Analysis

VALUE Offer - $1 for 2 Weeks then $29 a month!Click here

Access 7 Analysts Over 200 Markets Covered. Chat Room With Support

ADANIGREEN-w-indian-...

Related

BTCUSD Elliott Wave Technical Analysis: Is Bitcoin on the Verge of a Massive Breakout? Key Price Levels & Trading Strategy!

BTCUSD Elliott Wave Technical Analysis: Is Bitcoin on the Verge of a Massive Breakout? Key Price Levels & Trading Strategy!

This BTCUSD Elliott Wave analysis provides a detailed breakdown of Bitcoin price trends, key support...

Read More >
Forex Pair USDCAD Elliott Wave Forecast: Bearish Impulse Wave 3 Extends – Risk Levels, and Resistance Targets Identified

Forex Pair USDCAD Elliott Wave Forecast: Bearish Impulse Wave 3 Extends – Risk Levels, and Resistance Targets Identified

USDCAD shows a strong bearish Elliott Wave impulse on both daily and 4-hour charts. Wave 3 is in mot...

Read More >
EURUSD Elliott Wave Technical Analysis Reveals Bearish Trends in Daily and 4-Hour Charts with Impulsive Waves

EURUSD Elliott Wave Technical Analysis Reveals Bearish Trends in Daily and 4-Hour Charts with Impulsive Waves

The EURUSD Elliott Wave analysis highlights a strong bearish trend across daily and 4-hour charts. W...

Read More >
Australian Dollar/U.S. Dollar (AUDUSD) Elliott Wave Analysis: Accurate Currency Forecasts and Forex Technical Insights

Australian Dollar/U.S. Dollar (AUDUSD) Elliott Wave Analysis: Accurate Currency Forecasts and Forex Technical Insights

The AUDUSD Elliott Wave analysis provides a detailed look at the current market trends, focusing on ...

Read More >
Elliott Wave Analysis for KOSPI Trading: Stay Updated on the best KOSPI stocks, Daily Reports, and Essential Investment Tips

Elliott Wave Analysis for KOSPI Trading: Stay Updated on the best KOSPI stocks, Daily Reports, and Essential Investment Tips

This article provides a detailed Elliott Wave analysis of the KOSPI Composite Index, offering insigh...

Read More >
Key Phases in the Iron Ore Market and Future Price Predictions using the Iron Ore Commodity Elliott Wave Technical Analysis

Key Phases in the Iron Ore Market and Future Price Predictions using the Iron Ore Commodity Elliott Wave Technical Analysis

Stay informed with our comprehensive iron ore price forecast and Elliott Wave analysis. We cover ess...

Read More >

$1 for 2 Weeks

then $29 a month!

What a Special Offer!

Trade Recommendations

Unleash the power of deversified trading with our comprehensive portfolio, covering 250+ markets:

  • Stock Trades
  • Crypto Trades
  • Forex Trades
  • Commodity Trades
Elliott Wave Analysis

Gain a competitive edge with expert insights and AI-powered Elliott Wave charting into:

  • Global Indices
  • US Stocks & ASX Stocks
  • Forex & Crypto
  • Commodities
Top-Notch Trading Tools

Equip yourself with the tools of success:

  • Real-time Chat rooms
  • Elliott Wave Algorithm
  • Portfolio tools
  • TradingLevels
  • Screener
  • Trading Game
7 Elliott Wave Analysts

Stay ahead of the market with daily charts and insightful videos
Your secret to strategic trading!

JOIN HERE


Welcome to TradingLounge (ASIC A.R.No. 321187), specialists in trades, trading education and technical analysis, covering stocks, indices, commodities, forex and cryptocurrencies.

When you join TradingLounge you have access to everything we offer, including trade tools, educational content and a social platform to chat with like-minded investors.

Read more

@Copyright 2024 by tradinglounge.com

Contact Us

Australian no: 02 4787 6020

International no: +61 (2) 47876020

Pay with:

Find us on