11Jun

JSW Steel Elliott Wave Analysis Confirms Orange Wave 3 Strength, Navy Blue Wave 1 Riding Uptrend, Watch Invalidation Level

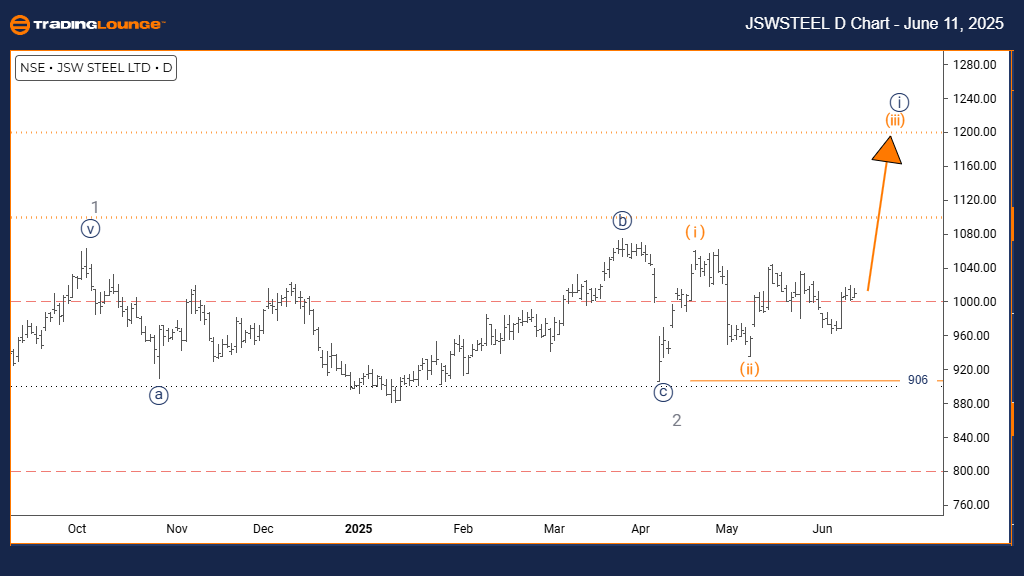
JSW STEEL Elliott Wave Analysis – TradingLounge Day Chart

JSW STEEL Elliott Wave Technical Analysis

FUNCTION: Bullish Trend

MODE: Impulsive

STRUCTURE: Orange Wave 3

POSITION: Navy Blue Wave 1

DIRECTION NEXT HIGHER DEGREES: Orange Wave 3 (Active)

DETAILS: Orange Wave 2 appears to have ended; Orange Wave 3 is actively progressing.

Wave Cancel Invalid Level: 906

The JSW STEEL daily chart reveals a sustained bullish trend under Elliott Wave analysis. The current wave progression shows a strong impulsive movement, highlighting Orange Wave 3 as the dominant wave. This wave unfolds within the broader structure of Navy Blue Wave 1, confirming bullish momentum in the stock's price action.

With Orange Wave 2 likely completed, the formation of Orange Wave 3 signals the start of a high-momentum phase. Orange Wave 3 typically presents the most vigorous price acceleration in Elliott Wave theory. Traders should note that Orange Wave 3 is unfolding actively, suggesting significant potential for continued upward moves.

The critical invalidation point remains at 906. A price dip below this level would challenge the bullish outlook and necessitate a fresh wave analysis. As long as JSW STEEL holds above this threshold, the technical setup supports further gains, reflecting increasing investor interest and market strength aligned with the ongoing Navy Blue Wave 1.

JSWSTEEL-d-indian-st...


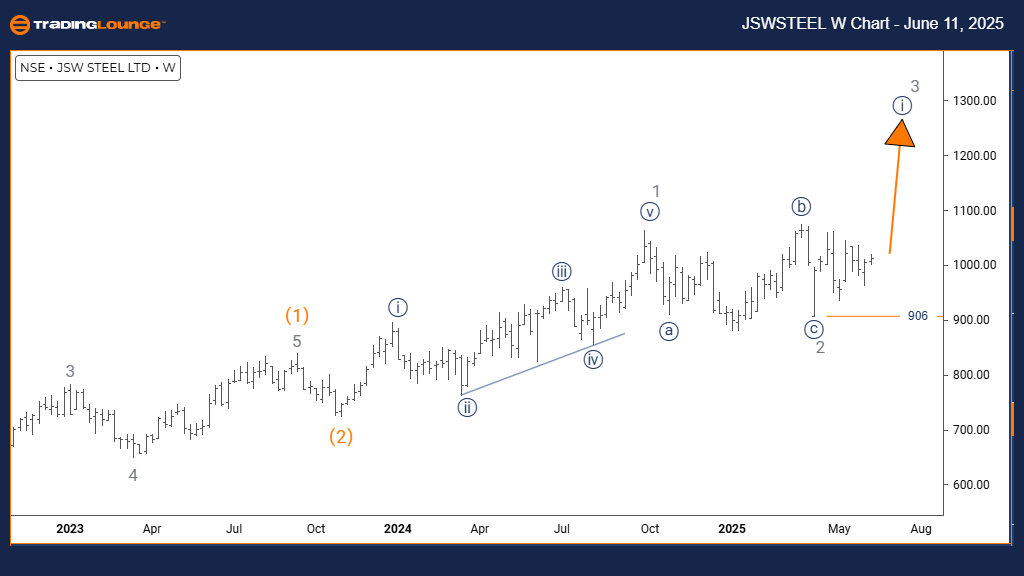
JSW STEEL Elliott Wave Analysis – TradingLounge Weekly Chart

JSW STEEL Elliott Wave Technical Analysis

FUNCTION: Bullish Trend

MODE: Impulsive

STRUCTURE: Navy Blue Wave 1

POSITION: Gray Wave 3

DIRECTION NEXT LOWER DEGREES: Navy Blue Wave 2

DETAILS: Gray Wave 2 appears complete; Navy Blue Wave 1 of Gray Wave 3 is in motion.

Wave Cancel Invalid Level: 906

The JSW STEEL weekly Elliott Wave analysis maintains a bullish outlook, supported by an impulsive price structure. The active wave count places the stock within Navy Blue Wave 1, a segment of the larger Gray Wave 3 trend. This configuration suggests the early phase of a potentially strong multi-week rally.

Analysis indicates the completion of Gray Wave 2, paving the way for Navy Blue Wave 1 within the developing Gray Wave 3. This transition usually leads into a dynamic bullish phase. The following anticipated move is Navy Blue Wave 2, expected to be corrective before the upward momentum resumes.

The invalidation level for this count is set at 906. A breach below this point would require a reassessment of the current wave structure. Until then, the bullish scenario holds, reinforcing upward expectations. With Gray Wave 3 advancing and Navy Blue Wave 1 in play, momentum continues to build. Monitoring price action around 906 remains crucial to validate this wave progression.

Technical Analyst: Malik Awais

Source: Visit Tradinglounge.com and learn from the Experts. Join TradingLounge Here 

Previous: COAL INDIA Elliott Wave Technical Analysis

VALUE Offer - Buy 1 Month & Get 3 Months!Click here

Access 7 Analysts Over 200 Markets Covered. Chat Room With Support

JSWSTEEL-w-indian-st...

Related

Spotify Technology S.A. (SPOT) Elliott Wave Technical Analysis: Chart Trends, Identifies Key Support levels, and Provides Insights

Spotify Technology S.A. (SPOT) Elliott Wave Technical Analysis: Chart Trends, Identifies Key Support levels, and Provides Insights

Get the latest Spotify (SPOT) stock analysis using Elliott Wave Theory. Our detailed report covers d...

Read More >
Elliott Wave analysis for Meta Platforms Inc. (META) Stock, Covering both Daily and 4-hour charts Technical Analysis

Elliott Wave analysis for Meta Platforms Inc. (META) Stock, Covering both Daily and 4-hour charts Technical Analysis

This article provides a detailed Elliott Wave analysis for Meta Platforms Inc. (META), covering both...

Read More >
VanEck Semiconductor ETF (SMH) Elliott Wave Analysis: Identifying Bullish Trends and Forecasting Future Price Movements

VanEck Semiconductor ETF (SMH) Elliott Wave Analysis: Identifying Bullish Trends and Forecasting Future Price Movements

This article provides an in-depth Elliott Wave analysis of the VanEck Semiconductor ETF (SMH), exami...

Read More >
Stay ahead of the Market with Our Expert XRP Chart Analysis and Price Predictions: XRPUSD Elliott Wave Technical Analysis

Stay ahead of the Market with Our Expert XRP Chart Analysis and Price Predictions: XRPUSD Elliott Wave Technical Analysis

Gain insights into XRP price movements with our in-depth Elliott Wave analysis. Discover trading str...

Read More >
BLOCK INC (SQ2) ASX Elliott Wave Analysis: Stock Forecast, Breakout Targets, Invalidation Points, and Trading Strategies for Investors

BLOCK INC (SQ2) ASX Elliott Wave Analysis: Stock Forecast, Breakout Targets, Invalidation Points, and Trading Strategies for Investors

This analysis covers BLOCK INC (SQ2) Elliott Wave technical patterns, highlighting breakout targets,...

Read More >
Make Informed Decisions with Accurate British Pound/U.S. Dollar Forex Pair (GBPUSD) Elliott Wave Technical Analysis

Make Informed Decisions with Accurate British Pound/U.S. Dollar Forex Pair (GBPUSD) Elliott Wave Technical Analysis

This in-depth GBPUSD Elliott Wave analysis provides a detailed forecast of the British Pound to US D...

Read More >

$1 for 2 Weeks

then $29 a month!

What a Special Offer!

Trade Recommendations

Unleash the power of deversified trading with our comprehensive portfolio, covering 250+ markets:

  • Stock Trades
  • Crypto Trades
  • Forex Trades
  • Commodity Trades
Elliott Wave Analysis

Gain a competitive edge with expert insights and AI-powered Elliott Wave charting into:

  • Global Indices
  • US Stocks & ASX Stocks
  • Forex & Crypto
  • Commodities
Top-Notch Trading Tools

Equip yourself with the tools of success:

  • Real-time Chat rooms
  • Elliott Wave Algorithm
  • Portfolio tools
  • TradingLevels
  • Screener
  • Trading Game
7 Elliott Wave Analysts

Stay ahead of the market with daily charts and insightful videos
Your secret to strategic trading!

JOIN HERE


Welcome to TradingLounge (ASIC A.R.No. 321187), specialists in trades, trading education and technical analysis, covering stocks, indices, commodities, forex and cryptocurrencies.

When you join TradingLounge you have access to everything we offer, including trade tools, educational content and a social platform to chat with like-minded investors.

Read more

@Copyright 2024 by tradinglounge.com

Contact Us

Australian no: 02 4787 6020

International no: +61 (2) 47876020

Pay with:

Find us on