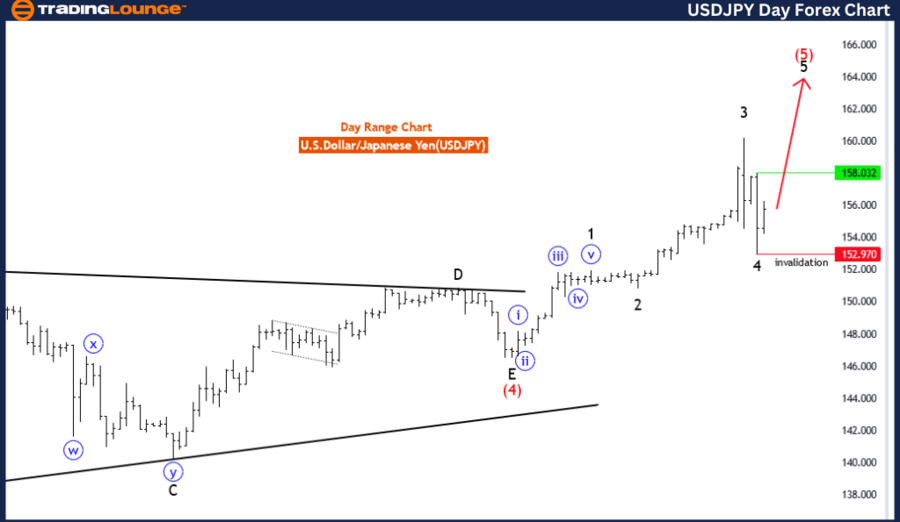
USDJPY Elliott Wave Analysis on Daily Chart
U.S. Dollar/Japanese Yen (USDJPY) Daily Chart Overview
Perspective: USDJPY Elliott Wave Technical Analysis
Function: Trend Development
Mode: Impulsive Sequence
Structure: Final Black Wave 5
Position: Late Stage Red Wave 5
Upcoming Direction: Continued Black Wave 5
Key Observation: Black Wave 4 concluded at 152.970, ushering in Black Wave 5.
Invalidate Level: 152.970
The USD/JPY Elliott Wave analysis on the daily chart provides a detailed study of the USD against JPY, employing Elliott Wave Theory to gauge its trend, structure, and forthcoming movements, while identifying pivotal levels for traders.
Function
The daily chart's trend function underscores a persistent directional trend, suggesting ongoing momentum rather than a near-term reversal or correction.
Mode
The impulsive mode, characterized by rapid, decisive price movements, indicates a well-established trend, typically progressing through five distinct sub-waves.
Structure
Presently, the market is navigating through "Black Wave 5"—the final segment in an impulsive wave sequence, potentially leading to a peak and subsequent market correction or reversal.
Position
Located within "Red Wave 5" of the larger Black Wave 5, the current market stance points towards the culmination of this impulsive phase, signaling potential upcoming shifts in market dynamics.
Direction for Next Higher Degrees
The trajectory for higher degrees remains oriented towards "Black Wave 5," suggesting the broader bullish trend may still have momentum, with further upward movements expected.
Details
This section notes the completion of "Black Wave 4" at 152.970, marking the end of the corrective phase and the initiation of Black Wave 5. Should prices fall below the 152.970 threshold, it could signify a breach of the Elliott Wave pattern, potentially altering the current bullish sentiment.
In conclusion, the USD/JPY Elliott Wave analysis for the daily chart posits that the currency pair is in the advanced stages of a bullish impulsive trend, with "Red Wave 5" active. The resolution of "Black Wave 4" at 152.970 has set the stage for the final impulsive stretch, with the potential for corrective movements or reversals once Black Wave 5 completes. The 152.970 level is crucial for validating the ongoing Elliott Wave structure, guiding trading strategies and analysis.
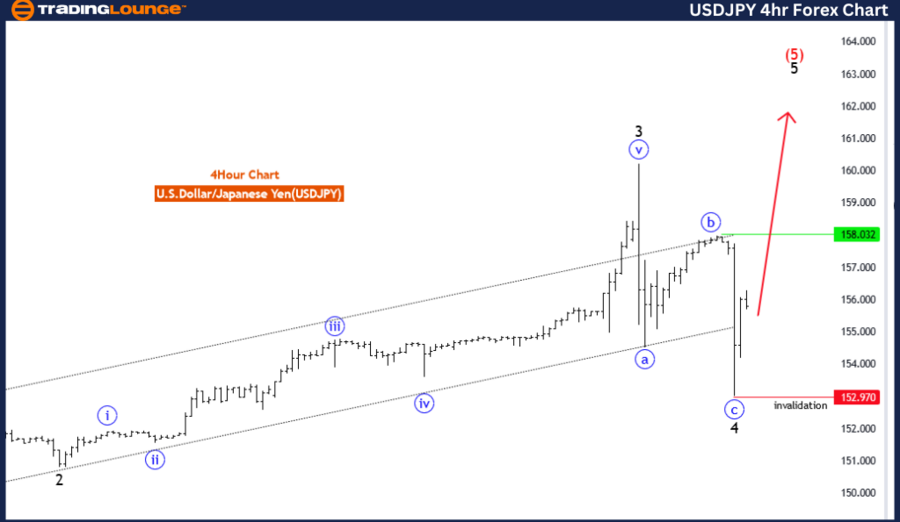
USDJPY Elliott Wave Analysis on 4-Hour Chart
U.S. Dollar/Japanese Yen (USDJPY) 4-Hour Chart Insight
Technical Analysis: Elliott Wave Methodology
Function: Trend Continuation
Mode: Impulsive Developments
Structure: Concluding Black Wave 5
Position: Terminal Red Wave 5
Next Direction: Sustaining Black Wave 5
Details: End of Black Wave 4 at 152.970, Transition to Black Wave 5.
Invalidate Level: 152.970
The 4-hour chart analysis of USD/JPY utilizes Elliott Wave Theory to delineate the current market structure and its projected path, offering insights into potential trading setups and associated risks.
Function
The analysis confirms the trend's continuation, highlighting an ongoing sequence of impulsive waves that portray a strong, directional push in the market.
Mode
Characterized as "impulsive," this mode suggests that the price action is marked by significant and quick movements, typically following a five-wave structure within the Elliott Wave framework, reinforcing the presence of a robust trend.
Structure
Identified as "Black Wave 5," this denotes the concluding wave in an impulsive series, often leading to a substantial correction or a directional shift once completed.
Position
The description as "Red Wave 5" within the broader Black Wave 5 suggests the market is nearing the end of this extensive impulsive trend, potentially gearing up for a reversal or significant correction.
Direction for Next Higher Degrees
The ongoing direction for higher degrees remains in "Black Wave 5," indicating that the larger bullish trend is not yet exhausted, hinting at additional opportunities for upward movement.
Details
The details highlight that "Black Wave 4" concluded at 152.970, signaling the cessation of the corrective phase and the commencement of the final Black Wave 5. The set invalidation level at 152.970 is critical; a drop below this point could challenge the integrity of the current Elliott Wave configuration, suggesting a potential shift in the market's trajectory.
In summary, the USD/JPY Elliott Wave Analysis for the 4 Hour Chart suggests that the market is in the final stages of an impulsive trend (black wave 5), with "red wave 5" underway. The black wave 4 was completed at 152.970, signaling the end of the correction and the beginning of the final impulsive phase. The Wave Cancel invalid level is also set at 152.970, serving as a critical threshold for monitoring the validity of the current Elliott Wave structure. This analysis can help traders understand the current trend and anticipate potential market changes.
Technical Analyst: Malik Awais
Source: visit Tradinglounge.com and learn From the Experts Join TradingLounge Here
See Previous: Australian Dollar / Japanese Yen (AUDJPY)
Special Trial Offer - 0.76 Cents a Day for 3 Months! Click here
Access 6 Analysts covering over 150 Markets. Chat Room With Support