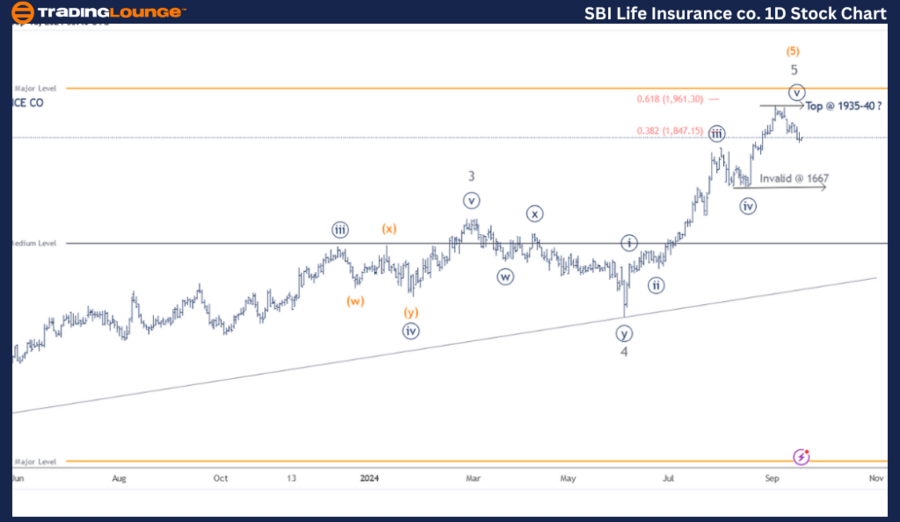
SBI Life Insurance Co – SBILIFE (1D Chart) Elliott Wave Technical Analysis

SBILIFE Elliott Wave Technical Analysis

Function: Larger Degree Trend Higher (Intermediate degree, orange)

Mode: Motive

Structure: Impulse

Position: Minute Wave ((v)) Navy

Details: Minute Wave ((v)) appears to have completed near 1940 or could terminate soon within Minor Wave 5 Grey of Intermediate Wave (5) Orange. Traders are advised to book profits as prices have begun to move lower.

Invalidation Point: 1667

SBI Life Insurance Co Daily Chart Technical Analysis and Potential Elliott Wave Counts

The daily chart for SBI Life Insurance Co shows an upward impulse wave formation from March 2023 to present, reaching highs between 1935-1940. There is a strong probability that the fifth wave has completed across multiple degrees. If this is correct, a larger degree corrective wave may soon begin, potentially moving against the 1940 resistance level.

The stock completed Intermediate Wave (4) Orange near the 1060-1065 range in March 2023. Since then, prices have rallied, reaching the 1935-1940 highs, and subdividing into five distinct waves. Notably, Minute Wave ((v)) of Minor Wave 5 Grey could either be complete or nearing completion around the 1960-1965 level.

The Fibonacci 0.618 extension from Wave 1 through Wave 3 was narrowly missed, meaning bulls may attempt another push higher. Alternatively, a break below 1667 would signal the top is in place and that bears are back in control.

SBI-Life-Insurance-C...


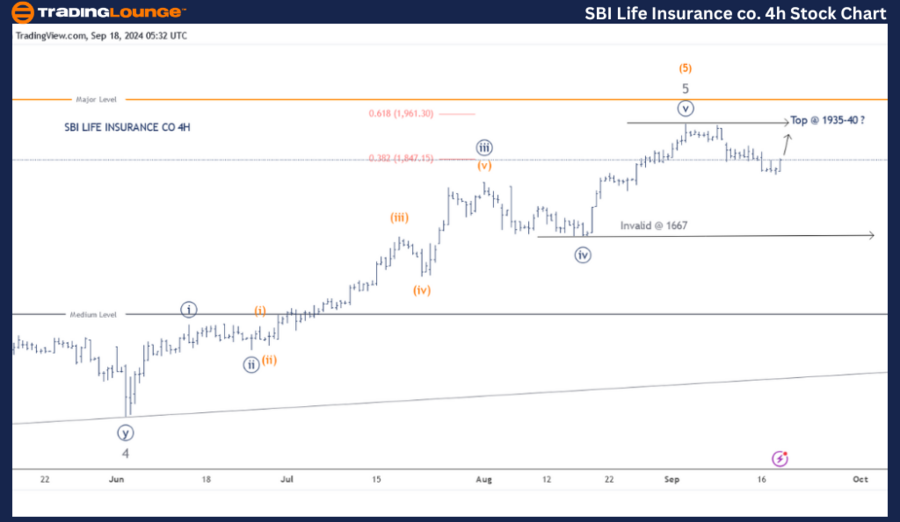
SBI Life Insurance Co – SBILIFE (4H Chart) Elliott Wave Technical Analysis

SBILIFE Elliott Wave Technical Analysis

Function: Larger Degree Trend Higher (Intermediate degree, orange)

Mode: Motive

Structure: Impulse

Position: Minute Wave ((v)) Navy

Details: Minute Wave ((v)) seems to have completed near 1940 or could be terminating soon within Minor Wave 5 Grey of Intermediate Wave (5) Orange. Subwaves within Wave ((v)) are not fully clear yet, and prices may still create a shallow high around 1960 before reversing.

Invalidation Point: 1667

SBI Life Insurance Co 4H Chart Technical Analysis and Potential Elliott Wave Counts

The 4-hour chart for SBI Life Insurance Co highlights the subwaves following Minor Wave 4 Grey, which completed around 1311 on June 4, 2024, similar to other stocks. Minute Wave ((iii)) was extended, and Wave ((iv)) was a flat correction. The subwaves within Minute Wave ((v)) remain unclear, leaving the possibility open for a retest of the 1940 level. However, 1667 remains a critical level to watch.

Conclusion

SBI Life Insurance Co may have completed its Intermediate Wave (5) Orange near the 1935-1940 range, or it could be approaching completion soon. A break below 1667 will confirm the completion.

Technical Analyst: Harsh Japee

Source: visit Tradinglounge.com and learn From the Experts Join TradingLounge Here 

Previous: HINDALCO Elliott Wave Technical Analysis 

Special Trial Offer - 0.76 Cents a Day for 3 Months! Click here

Access 7 Analysts Over 200 Markets Covered. Chat Room With Support

SBI-Life-Insurance-C...

Related

Euro/U.S.Dollar(EURUSD) Elliott Wave Technical Analysis: Key Insights for Trading Success | 7th February 24

Euro/U.S.Dollar(EURUSD) Elliott Wave Technical Analysis: Key Insights for Trading Success | 7th February 24

EURUSD currency pair with expert Elliott Wave analysis dated 7th February 24. Trends and impulsive m...

Read More >
Elliott Wave Trading Strategies for SP500, NASDAQ 100 & Leading Tech Stocks

Elliott Wave Trading Strategies for SP500, NASDAQ 100 & Leading Tech Stocks

Major indices and tech stocks, including SP500, NASDAQ 100, Apple, Tesla, Amazon, and Bitcoin, are c...

Read More >
NZDUSD Elliott Wave Technical Analysis: Bullish Wave 3 Momentum and Price Forecast on Daily and 4-Hour Forex Charts

NZDUSD Elliott Wave Technical Analysis: Bullish Wave 3 Momentum and Price Forecast on Daily and 4-Hour Forex Charts

Analyse NZDUSD’s Elliott Wave structure with our updated daily and 4-hour forecast. Discover wave 3...

Read More >
S&P 500 Elliott Wave Forecast: Bullish Trend Develops as SPX Forms Wave 1 of 3 After Completing Wave 2 Correction

S&P 500 Elliott Wave Forecast: Bullish Trend Develops as SPX Forms Wave 1 of 3 After Completing Wave 2 Correction

S&P 500 is forming a bullish Elliott Wave impulse pattern. Gray wave 2 is complete and navy blue wav...

Read More >
Euro/U.S.Dollar(EURUSD) Forex : Detailed Elliott Wave Technical Analysis

Euro/U.S.Dollar(EURUSD) Forex : Detailed Elliott Wave Technical Analysis

Elliott Wave analysis for the EURUSD currency pair offers insights into potential price movements an...

Read More >
Solana Price Prediction and SOLUSD Elliott Wave Analysis Reveals Short-Term Strategy Ahead of Wave C Correction – April 2025 Forecast

Solana Price Prediction and SOLUSD Elliott Wave Analysis Reveals Short-Term Strategy Ahead of Wave C Correction – April 2025 Forecast

This analysis covers Solana’s corrective Wave B formation and potential decline into Wave C, suppor...

Read More >

$1 for 2 Weeks

then $29 a month!

What a Special Offer!

Trade Recommendations

Unleash the power of deversified trading with our comprehensive portfolio, covering 250+ markets:

  • Stock Trades
  • Crypto Trades
  • Forex Trades
  • Commodity Trades
Elliott Wave Analysis

Gain a competitive edge with expert insights and AI-powered Elliott Wave charting into:

  • Global Indices
  • US Stocks & ASX Stocks
  • Forex & Crypto
  • Commodities
Top-Notch Trading Tools

Equip yourself with the tools of success:

  • Real-time Chat rooms
  • Elliott Wave Algorithm
  • Portfolio tools
  • TradingLevels
  • Screener
  • Trading Game
7 Elliott Wave Analysts

Stay ahead of the market with daily charts and insightful videos
Your secret to strategic trading!

JOIN HERE


Welcome to TradingLounge (ASIC A.R.No. 321187), specialists in trades, trading education and technical analysis, covering stocks, indices, commodities, forex and cryptocurrencies.

When you join TradingLounge you have access to everything we offer, including trade tools, educational content and a social platform to chat with like-minded investors.

Read more

@Copyright 2024 by tradinglounge.com

Contact Us

Australian no: 02 4787 6020

International no: +61 (2) 47876020

Pay with:

Find us on