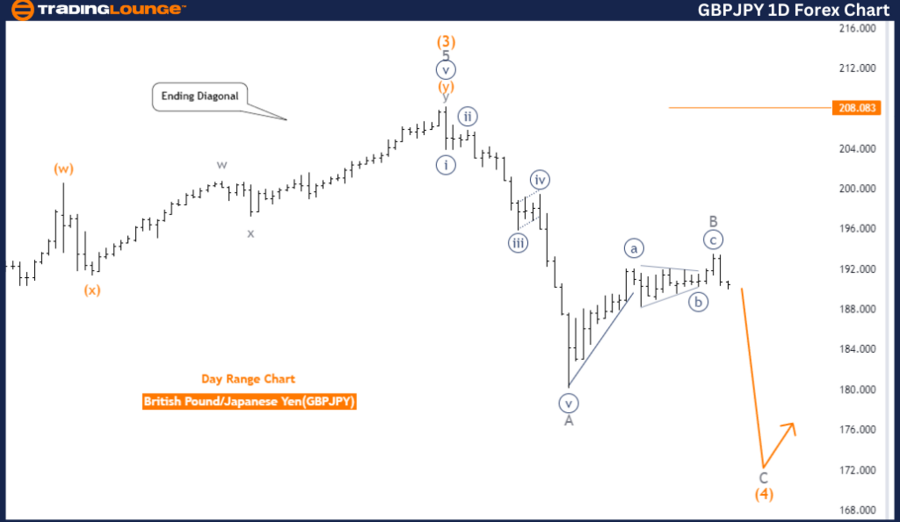
GBPJPY Elliott Wave Analysis: Trading Lounge Day Chart
British Pound/Japanese Yen (GBPJPY) Day Chart Analysis
GBPJPY Elliott Wave Technical Analysis
-
Function: Counter Trend
-
Mode: Impulsive as C
-
Structure: Gray Wave C
-
Position: Orange Wave 4
-
Direction (Next Higher Degrees): Orange Wave 5
-
Details: Gray Wave B of 4 appears completed, with Gray Wave C of 4 now active.
- Wave Cancel Invalidation Level: 208.083
Analysis Overview
The GBPJPY Day Chart, analyzed using Elliott Wave theory, reveals the market is in a counter-trend phase. The impulsive mode as C indicates a strong corrective movement against the previous trend. The current structure is Gray Wave C, positioned within Orange Wave 4.
The analysis suggests that Gray Wave B of Wave 4 has likely finished, enabling Gray Wave C of Wave 4 to take form. This wave structure is a vital part of the broader corrective phase. As Gray Wave C progresses, it could eventually lead to Orange Wave 5, marking the next significant move in the market.
Wave Structure Insights
The focus is on the evolution of Gray Wave C, as its development will provide critical insights into the market’s future direction. This wave is expected to progress until the structure completes or faces invalidation.
Critical Level to Watch
The key level to monitor is the wave cancellation invalidation point at 208.083. If the market hits or exceeds this level, the current Elliott Wave count becomes invalid, meaning the expected wave structure no longer holds. Until this point is breached, the corrective phase is likely to continue.
Summary
The GBPJPY Day Chart reflects a counter-trend phase, highlighted by the impulsive wave structure Gray Wave C, which follows the completion of Gray Wave B within Orange Wave 4. The wave cancellation invalidation level is set at 208.083, serving as a crucial marker to sustain the current wave count.
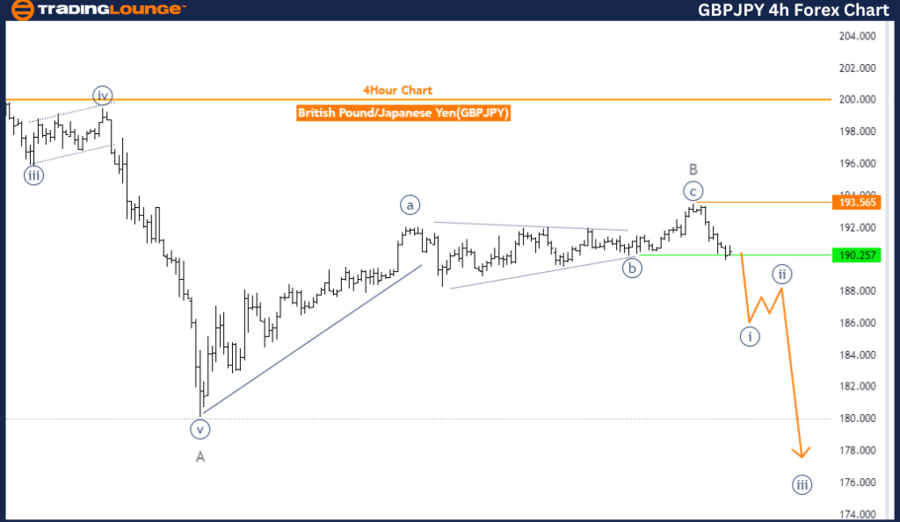
GBPJPY Elliott Wave Analysis: Trading Lounge 4-Hour Chart
British Pound/Japanese Yen (GBPJPY) 4-Hour Chart Analysis
GBPJPY Currency Pair Analysis
-
Function: Counter Trend
-
Mode: Impulsive
-
Structure: Navy Blue Wave 1
-
Position: Gray Wave C
-
Direction (Next Higher Degrees): Navy Blue Wave 2
-
Details: Gray Wave B of 4 appears complete, and Navy Blue Wave 1 of Gray Wave C of 4 is now active.
- Wave Cancel Invalidation Level: 193.565
Analysis Overview
The GBPJPY 4-hour chart, analyzed through Elliott Wave theory, indicates the market is in a counter-trend phase. The mode is impulsive, showing a strong directional movement within this corrective period. The current structure is Navy Blue Wave 1 within the larger Gray Wave C.
The analysis reveals that Gray Wave B of Wave 4 is likely finished, paving the way for the development of Navy Blue Wave 1 within Gray Wave C of Wave 4. This phase is essential in determining the overall market trend within the current corrective wave.
Wave Structure Insights
The position of Navy Blue Wave 1 within Gray Wave C suggests the market is in the early stages of this wave structure. This progression is key to forecasting the next movements in line with the ongoing corrective trend.
Critical Level to Watch
The wave cancellation invalidation level at 193.565 is pivotal. If the market surpasses this level, it invalidates the current Elliott Wave count, requiring a reevaluation of the market structure. Until this threshold is breached, the wave count remains valid, and the market is expected to continue in the corrective phase.
Summary
The GBPJPY 4-hour chart signals a counter-trend phase in an impulsive mode. The wave structure is forming within Navy Blue Wave 1 of Gray Wave C, following the completion of Gray Wave B. The wave cancellation invalidation level is set at 193.565, acting as a key indicator for preserving the current Elliott Wave count.
Technical Analyst: Malik Awais
Source: visit Tradinglounge.com and learn From the Experts Join TradingLounge Here
Previous: Euro/U.S. Dollar (EURUSD) Elliott Wave Technical Analysis
Special Trial Offer - 0.76 Cents a Day for 3 Months! Click here
Access 7 Analysts Over 200 Markets Covered. Chat Room With Support