GBPUSD Elliott Wave Analysis Trading Lounge Day Chart, 11 January 24
British Pound/U.S.Dollar (GBPUSD) Day Chart
GBPUSD Elliott Wave Technical Analysis
Function: Trend
Mode: impulsive
Structure: blue wave 5 of 1
Position: Red wave 3/C
Direction;Next Lower Degrees: Black wave 2
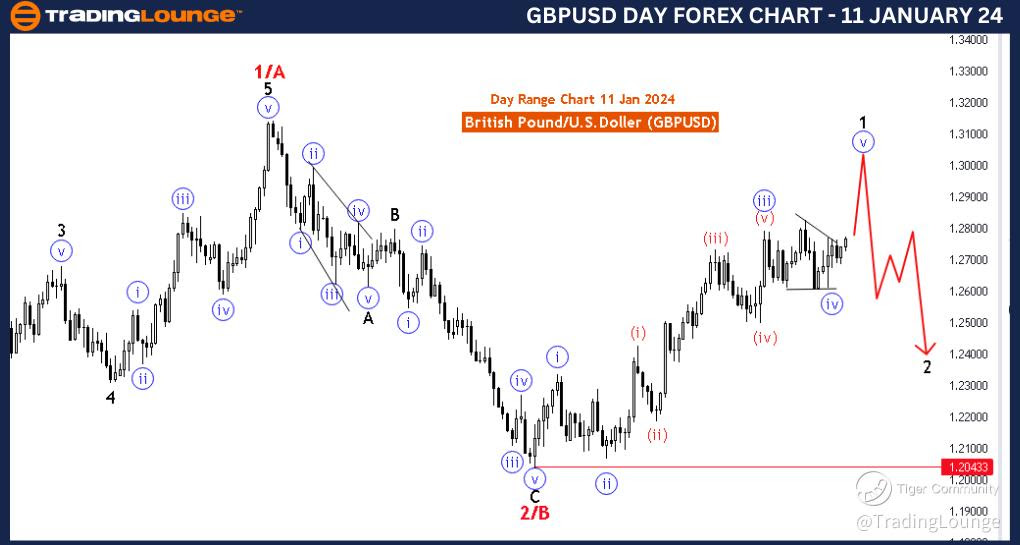
Details:blue wave 4 of black wave 1 looking completed , now blue wave 5 of 1 is in play . Wave Cancel invalid level: 1.20433
The "GBPUSD Elliott Wave Analysis Trading Lounge Day Chart" for 11 January 24, presents a comprehensive analysis of the British Pound/U.S. Dollar (GBPUSD) currency pair using Elliott Wave theory. This analysis provides valuable insights for traders seeking to understand potential price movements and trend developments on a daily timeframe.
The identified "Function" is described as "Trend," indicating a focus on assessing and understanding the prevailing trend in the market. This suggests that the analysis aims to position the current price movements within the broader trend context, aiding traders in making informed decisions.
The specified "Mode" is labeled as "Impulsive," suggesting that the market is currently exhibiting characteristics of an impulsive wave. Impulsive waves are typically associated with strong, directional price movements aligned with the prevailing trend. This information is crucial for traders looking to identify potential trading opportunities.
The primary "Structure" is defined as "blue wave 5 of 1." This signifies that the market is currently within the fifth and final wave of the impulsive sequence within the larger Elliott Wave count of wave 1. Recognizing the specific structure of the current wave is essential for traders to anticipate potential price dynamics.
The identified "Position" is labeled as "Red wave 3/C." This provides insights into the current position of the market within the broader Elliott Wave sequence. In this case, the market is in the midst of the third wave (labeled as C), indicating a strong directional move within the ongoing impulsive sequence.
In terms of "Direction; Next Lower Degrees," the analysis points to the anticipated "Black wave 2." This implies that after the completion of the current impulsive sequence (blue wave 5 of 1), a corrective wave labeled as Black wave 2 is expected. Understanding the expected direction of the next wave is crucial for traders to position themselves accordingly.
The "Details" section notes that "blue wave 4 of black wave 1" is looking completed. This suggests the end of the corrective phase, and now "blue wave 5 of 1" is in play. This information is valuable for traders as it indicates the resumption of the impulsive wave and potential further upward movements.
The "Wave Cancel invalid level" is identified as "1.20433." This level serves as a critical reference point, and if reached, it would invalidate the current wave count. Traders may need to reassess their analysis if the market reaches this level.
In summary, the GBPUSD Elliott Wave Analysis for the Day Chart on 11 January 24, suggests that the market is in an impulsive phase, with blue wave 5 of 1 currently in play. The completion of the corrective phase (blue wave 4 of black wave 1) sets the stage for potential upward movements in the ongoing impulsive sequence. Traders are advised to monitor the progression of the impulsive wave and consider the invalidation level at 1.20433.
Technical Analyst : Malik Awais
Source : Tradinglounge.com get trial here!

GBPUSD Elliott Wave Analysis Trading Lounge 4 Hour Chart, 11 January 24
British Pound/U.S.Dollar (GBPUSD) 4 Hour Chart
GBPUSD Elliott Wave Technical Analysis
Function: Trend
Mode: impulsive
Structure: blue wave 5 of 1
Position: Red wave 3/C
Direction;Next Lower Degrees: Black wave 2
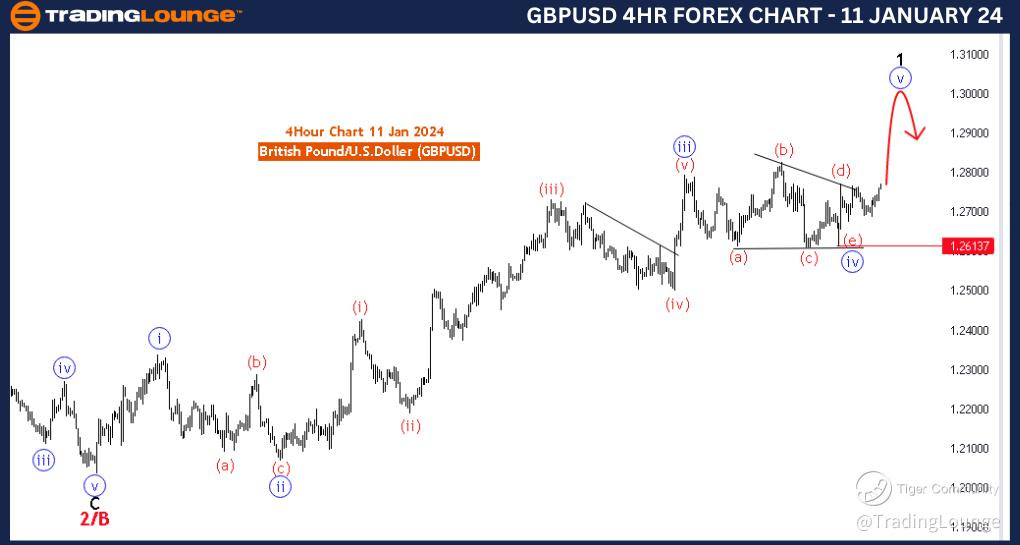
Details:blue wave 4 of black wave 1 looking completed , now blue wave 5 of 1 is in play . Wave Cancel invalid level: 1.26137
The "GBPUSD Elliott Wave Analysis Trading Lounge 4 Hour Chart" for 11 January 24, provides a detailed analysis of the British Pound/U.S. Dollar (GBPUSD) currency pair using Elliott Wave theory. This analysis is crucial for traders seeking insights into potential price movements and trend developments.
The identified "Function" is labeled as "Trend," suggesting a focus on understanding the prevailing trend in the market. This indicates that the analysis primarily aims to position the current price movements within the broader trend context.
The specified "Mode" is characterized as "Impulsive," indicating that the market is currently exhibiting characteristics of an impulsive wave. Impulsive waves are typically associated with strong, directional price movements in the direction of the prevailing trend.
The primary "Structure" is described as "blue wave 5 of 1." This signifies that the market is currently in the fifth and final wave of the impulsive sequence within the larger Elliott Wave count of wave 1. Recognizing the specific structure of the current wave is crucial for traders to anticipate potential price dynamics.
The identified "Position" is labeled as "Red wave 3/C," providing insights into the current position of the market within the broader Elliott Wave sequence. In this case, the market is in the midst of the third wave (labeled as C), suggesting a strong directional move within the ongoing impulsive sequence.
In terms of "Direction Next Lower Degrees," the analysis points to the anticipated "Black wave 2." This implies that after the completion of the current impulsive sequence (blue wave 5 of 1), a corrective wave labeled as Black wave 2 is expected.
The "Details" section notes that "blue wave 4 of black wave 1" is looking completed, signaling the end of the corrective phase. Now, "blue wave 5 of 1" is in play, indicating the resumption of the impulsive wave. This information is valuable for traders to align their positions with the current market dynamics.
The "Wave Cancel invalid level" is identified as "1.26137." This level serves as a critical reference point, and if reached, it would invalidate the current wave count. Traders may need to reassess their analysis if the market reaches this level.
In summary, the GBPUSD Elliott Wave Analysis for the 4 Hour Chart on 11 January 24, suggests that the market is in an impulsive phase, with blue wave 5 of 1 currently in play. The completion of the corrective phase (blue wave 4 of black wave 1) sets the stage for potential upward movements in the ongoing impulsive sequence. Traders are advised to monitor the progression of the impulsive wave and consider the invalidation level at 1.26137.
Technical Analyst : Malik Awais
Source : Tradinglounge.com get trial here!
