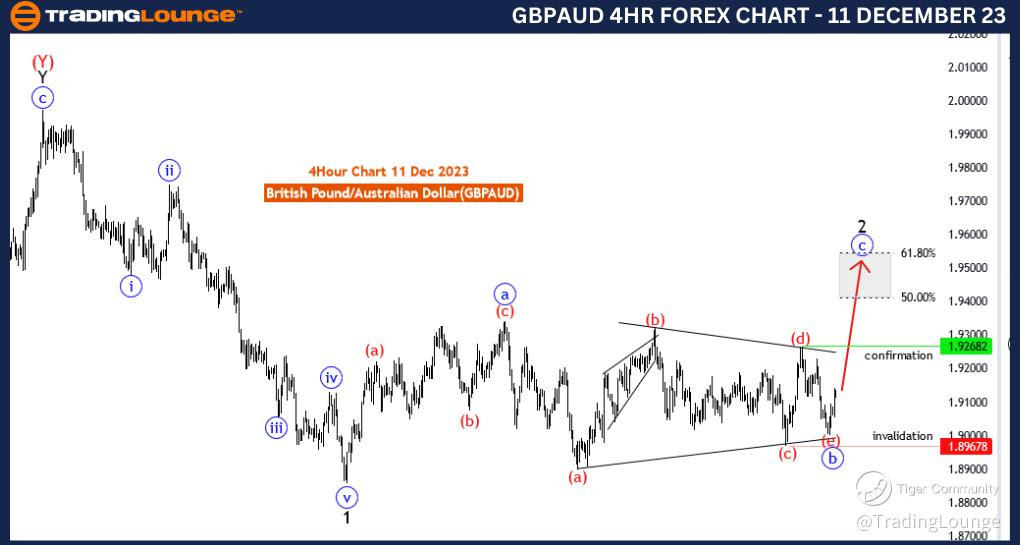
GBPAUD Elliott Wave Analysis Trading Lounge 4 Hour Chart, 11 December 23
British Pound/ Australian Dollar(GBPAUD) 4 Hour Chart
GBPAUD Elliott Wave Technical Analysis
Function: Counter Trend
Mode: impulsive as C
Structure:C of 2
Position: black wave 2
Direction Next Higher Degrees:blue wave C of 2( started)
Details: blue wave B of 2 looking completed at 1.90021, now blue wave C of 2 started . Wave Cancel invalid level: 1.89678
The "GBPAUD Elliott Wave Analysis Trading Lounge 4 Hour Chart" for 11 December 23, presents a detailed examination of the British Pound/Australian Dollar (GBPAUD) currency pair using Elliott Wave principles. This analysis aims to provide traders with comprehensive insights into the current market trends, corrective phases, and potential upcoming movements within a four-hour timeframe.
The market "Function" is identified as "Counter Trend," indicating that the analysis is focused on understanding and potentially profiting from counter trend movements. Recognizing counter trend phases is crucial for traders looking to capitalize on corrective waves against the prevailing trend.
The market "Mode" is characterized as "impulsive as C," suggesting a phase dominated by strong and decisive price movements. The impulsive nature of the movement indicates a potentially powerful C wave within the corrective structure.
The primary "Structure" is labeled as "C of 2," signifying the current wave's place within the broader Elliott Wave sequence. Understanding the structure helps traders contextualize the current corrective phase within the larger market trend.
The specified "Position" is denoted as "black wave 2," offering insights into the current wave count within the overarching Elliott Wave framework. This knowledge assists traders in assessing the potential risks and rewards associated with their trades.
In terms of "Direction Next Higher Degrees," the projection is "blue wave C of 2 (started)." This suggests the initiation of the C wave within the larger corrective structure. Traders can use this information to anticipate potential future market movements.
The "Details" section highlights that "blue wave B of 2" is considered completed at 1.90021, and now "blue wave C of 2" has started. This signifies the completion of a corrective phase and the potential beginning of a new impulsive movement.
The "Wave Cancel invalid level" is identified as "1.89678." This level is crucial as it represents a point at which the current wave count would be invalidated, prompting a reassessment of the prevailing market conditions.
In summary, the GBPAUD Elliott Wave Analysis for the 4 Hour Chart on 11 December 23, indicates a counter trend impulsive phase labeled as "C of 2." The analysis provides insights into the wave structure, position, expected next wave, and a crucial level for potential wave cancellation within the broader corrective trend. Traders can leverage this information to make informed decisions aligned with the prevailing market dynamics.
Technical Analyst: Malik Awais
Source: Tradinglounge.com get trial here!
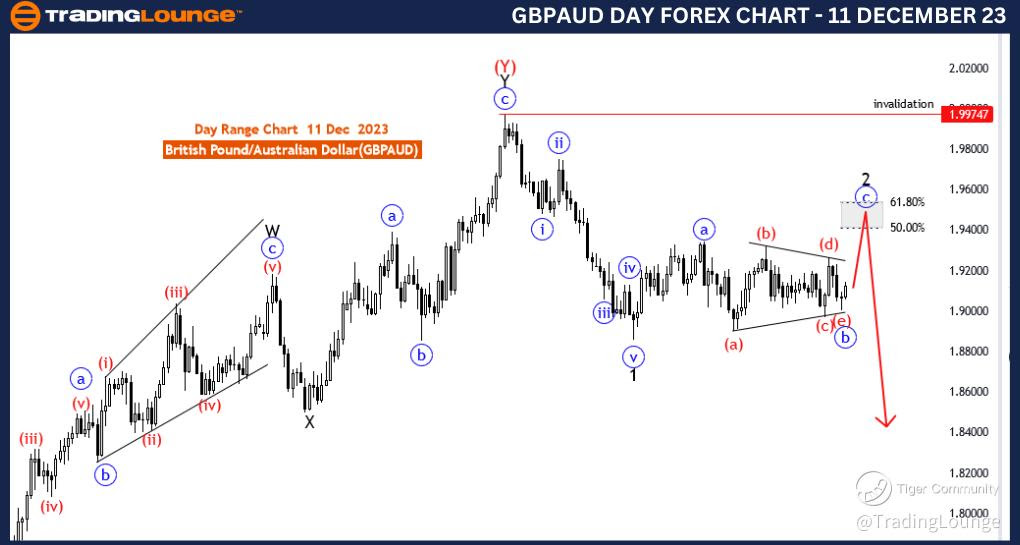
GBPAUD Elliott Wave Analysis Trading Lounge Day Chart, 11 December 23
British Pound/ Australian Dollar(GBPAUD) Day Chart
GBPAUD Elliott Wave Technical Analysis
Function: Trend
Mode: corrective
Structure:C of 2
Position: red wave 1
Direction Next Lower Degrees:Black wave 3
Details: blue wave C of 2 is in play . Wave Cancel invalid level: 1.99747
The "GBPAUD Elliott Wave Analysis Trading Lounge Day Chart" for 11 December 23, provides an in-depth examination of the British Pound/Australian Dollar (GBPAUD) currency pair using Elliott Wave principles within a daily timeframe. The analysis aims to offer traders valuable insights into prevailing market trends, corrective patterns, and potential upcoming movements.
The market "Function" is identified as "Trend," indicating that the primary focus of the analysis is on understanding and potentially profiting from the overarching market trend. Recognizing the broader trend is crucial for traders to align their strategies with the prevailing market direction.
The market "Mode" is characterized as "corrective," signifying a phase dominated by corrective price movements. Corrective phases are essential components of market cycles, providing opportunities for traders to enter positions in alignment with the primary trend.
The primary "Structure" is labeled as "C of 2," indicating the current wave's place within the broader Elliott Wave sequence. This understanding helps traders contextualize the current corrective phase within the larger market trend.
The specified "Position" is denoted as "red wave 1," offering insights into the current wave count within the overarching Elliott Wave framework. This knowledge assists traders in assessing the potential risks and rewards associated with their trades.
In terms of "Direction Next Lower Degrees," the projection is "Black wave 3," suggesting the expected next major wave within the larger Elliott Wave structure. Traders can use this information to anticipate potential future market movements in the downward direction.
The "Details" section highlights that "blue wave C of 2" is currently in play. This indicates that the market is currently undergoing a corrective phase within the broader trend.
The "Wave Cancel invalid level" is identified as "1.99747." This level is crucial as it represents a point at which the current wave count would be invalidated, prompting a reassessment of the prevailing market conditions.
In summary, the GBPAUD Elliott Wave Analysis for the Day Chart on 11 December 23, indicates a corrective phase labeled as "C of 2" within the broader trend. The analysis provides insights into the wave structure, position, expected next wave, and a crucial level for potential wave cancellation within the larger corrective trend. Traders can leverage this information to make informed decisions aligned with the prevailing market dynamics.
Technical Analyst: Malik Awais
Source: Tradinglounge.com get trial here!