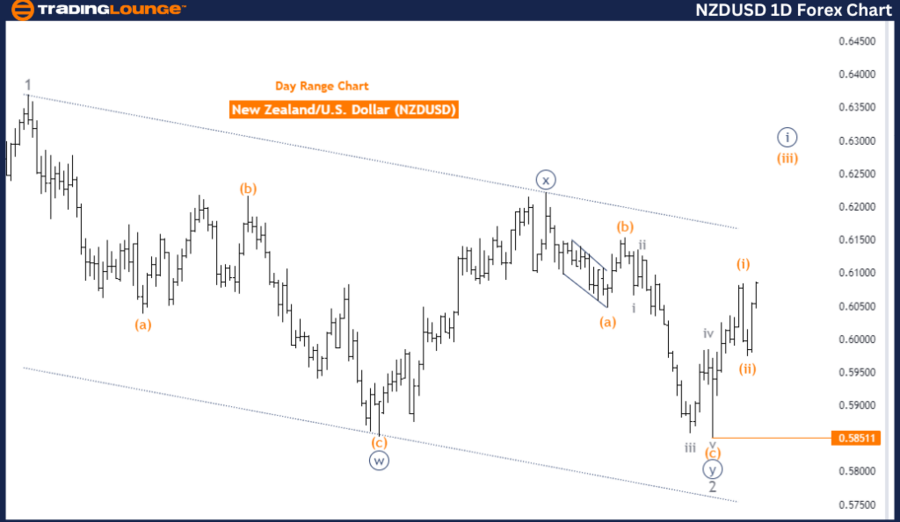
NZDUSD Elliott Wave Analysis - Trading Lounge Day Chart
New Zealand Dollar/ U.S. Dollar (NZDUSD) Day Chart Analysis
NZDUSD Elliott Wave Technical Analysis
Function: Trend
Mode: Impulsive
Structure: Orange Wave 3
Position: Navy Blue Wave 1
Direction Next Higher Degrees: Orange Wave 3 (continue)
Details: Orange Wave 2 appears completed; now, Orange Wave 3 of 1 is in play.
Wave Cancel Invalid Level: 0.58511
The NZDUSD daily chart, analyzed using Elliott Wave theory, indicates a current upward trend with an impulsive wave structure in focus. The primary wave being monitored is Orange Wave 3, highlighting ongoing bullish momentum. This wave is part of a larger degree wave structure identified as Navy Blue Wave 1, suggesting that the market could be in the early stages of a longer-term upward trend.
Orange Wave 2, representing a corrective phase within this sequence, appears to have concluded. Following this correction, Orange Wave 3 has initiated, indicating that the market is experiencing an upward thrust. In Elliott Wave theory, Wave 3 is typically the most powerful and extended wave in the sequence, often leading to significant price increases.
The next higher degree wave, Orange Wave 3, is expected to maintain its upward trajectory as the market continues through this impulsive phase. The current wave count suggests that further upward movement is likely as Orange Wave 3 unfolds.
A critical level to monitor is the wave cancel invalid level at 0.58511. A drop below this level would invalidate the current Elliott Wave count, implying a possible change in the wave structure or a trend reversal.
In summary, the NZDUSD daily chart shows a strong upward trend, with Orange Wave 3 in progress following the completion of Orange Wave 2. The market is expected to continue rising as part of this Wave 3, with the invalidation level at 0.58511 being critical; a breach would indicate a potential shift in the current wave analysis.
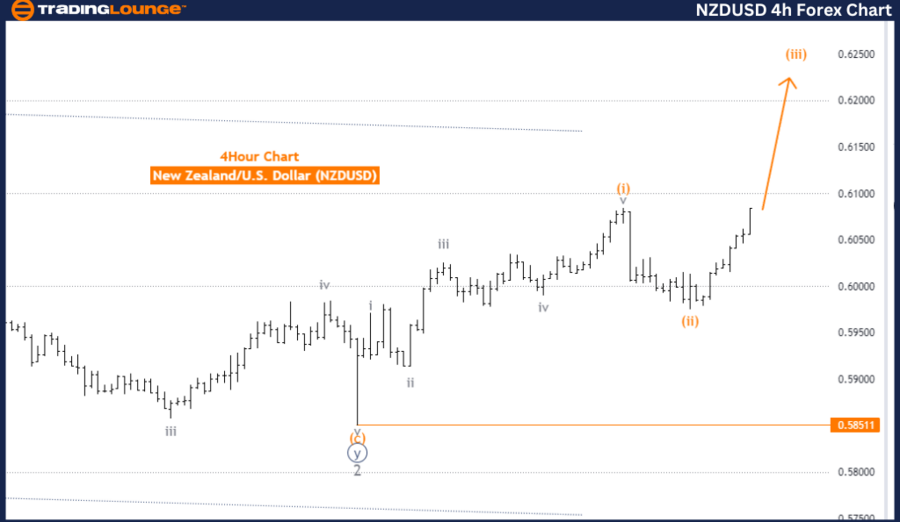
NZDUSD Elliott Wave Analysis - Trading Lounge 4-Hour Chart
New Zealand Dollar/ U.S. Dollar (NZDUSD) 4-Hour Chart Analysis
NZDUSD Elliott Wave Technical Analysis
Function: Trend
Mode: Impulsive
Structure: Orange Wave 3
Position: Navy Blue Wave 1
Direction Next Higher Degrees: Orange Wave 3 (continue)
Details: Orange Wave 2 appears completed; now, Orange Wave 3 of 1 is in play.
Wave Cancel Invalid Level: 0.58511
The NZDUSD 4-hour chart, analyzed through Elliott Wave theory, is currently in a strong upward trend, characterized by an impulsive wave structure. The primary wave under focus is Orange Wave 3, indicating a continuation of bullish momentum. This wave is part of a larger degree wave structure identified as Navy Blue Wave 1, suggesting the market could be in the early stages of a long-term upward trend.
Orange Wave 2, representing a corrective phase within this sequence, seems to have concluded. Following the completion of this correction, Orange Wave 3 has initiated, signaling that the market is experiencing an upward movement. In the Elliott Wave sequence, Wave 3 is typically the most powerful and extended wave, often leading to significant price gains.
The direction of the next higher-degree wave, Orange Wave 3, is expected to continue its upward trajectory as it progresses through this impulsive phase. The current wave count implies that the market is poised for further gains as Orange Wave 3 develops.
A crucial level to monitor is the wave cancel invalid level, set at 0.58511. If the market drops below this point, it would invalidate the current Elliott Wave count, suggesting a potential shift in the wave structure or a reversal in the trend.
In summary, the NZDUSD 4-hour chart shows a strong upward trend, with Orange Wave 3 currently unfolding after the completion of Orange Wave 2. The market is expected to continue rising as part of Wave 3, with the key invalidation level being 0.58511, serving as a critical point in the current wave analysis.
Technical Analyst: Malik Awais
Source: visit Tradinglounge.com and learn From the Experts Join TradingLounge Here
Previous: GBPUSD Elliott Wave Technical Analysis
Special Trial Offer - 0.76 Cents a Day for 3 Months! Click here
Access 7 Analysts Over 170 Markets Covered. Chat Room With Support