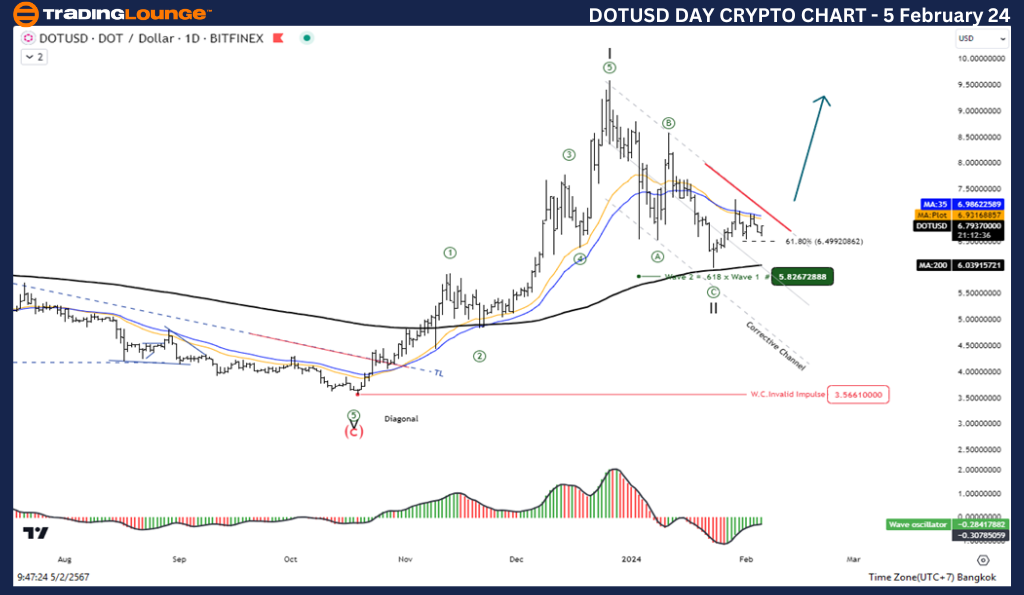
Elliott Wave Analysis TradingLounge Daily Chart, 5 February 24,

The potential of the Polkadot / U.S. dollar(DOTUSD) through Elliott Wave Analysis can provide traders with invaluable insights into market trends and potential entry points. Let's delve into the latest analysis as of February 5, 2024.

DOTUSD Elliott Wave Technical Analysis:

  • Function: Capitalizing on Counter Trend movements.
  • Mode: Executing Corrective strategies.
  • Structure: Embracing the Zigzag pattern.
  • Position: Currently in Wave C.
  • Direction Next higher Degrees: Anticipating wave (II) of Impulse.
  • Wave Cancel invalid level: Critical at 3.566.

Intriguingly, Wave (II) possibly concluded at the 5.992 mark, signaling a potential upsurge in Wave (III).

Polkadot / U.S. dollar(DOTUSD) Trading Strategy: Seizing the moment, as Wave II correction likely reached its terminus at 5.992, traders should brace for an upward trajectory in Wave III. Now is the time to seek entry points and align with the prevailing bullish sentiment.

Polkadot / U.S. dollar(DOTUSD) Technical Indicators:

  • Price: Positioned Above the MA200, indicating a robust uptrend.
  • Wave Oscillators: Presenting a bullish Momentum, fostering a favorable trading environment.

For more insights and analysis, visit Tradinglounge.com and learn From the Experts Join TradingLounge Here 

With this meticulous Elliott Wave analysis, traders can strategize effectively and capitalize on lucrative opportunities in the DOTUSD market. Join the ranks of successful traders by leveraging expert insights and staying ahead of the curve.

DOTUSD-Day-crypto-ch...


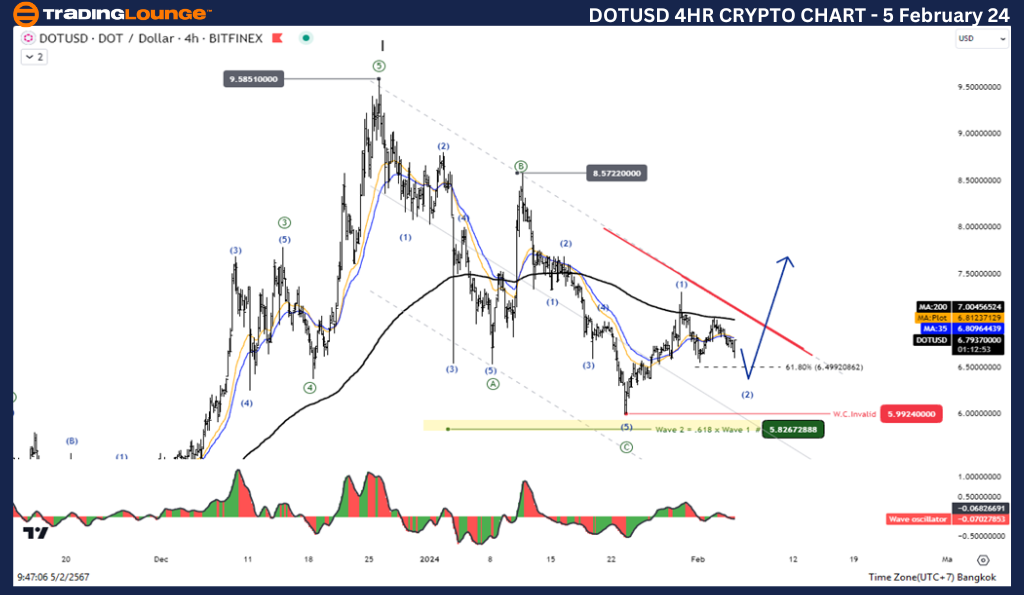
Elliott Wave Analysis TradingLounge 4Hr Chart, 5 February 24,

Polkadot / U.S. dollar(DOTUSD)

DOTUSD Elliott Wave Technical Analysis

Function: Counter Trend

Mode: Corrective

Structure: Zigzag

Position: Wave C

Direction Next higher Degrees: wave (II) of Impulse

Wave Cancel invalid level: 3.566

Details: Wave (II) maybe is complete at 5.992 level and the price increase again in Wave (III)

Polkadot / U.S. dollar(DOTUSD) Trading Strategy: Wave II correction appears to have ended at the 5.992 level and prices are entering an uptrend in Wave III, looking for an entry opportunity. Join the trend again in an upward direction.

Polkadot / U.S. dollar(DOTUSD)Technical Indicators: The price is below the MA200 indicating a downtrend, Wave Oscillators a bearish Momentum.

TradingLounge Analyst: Kittiampon Somboonsod, CEWA

See Previous: VeChain (VETUSD)

DOTUSD-4hr-crypto-ch...

Related

Discover the in-depth Deere & Co.(DE) Stocks Elliott Wave Technical Analysis

Discover the in-depth Deere & Co.(DE) Stocks Elliott Wave Technical Analysis

Discover the in-depth Elliott Wave Analysis for Deere & Co. (DE), focusing on daily and 4-hour chart...

Read More >
Wheat Commodity Elliott Wave Technical Analysis Indicates the End of a Long-term Bearish Cycle and an Upcoming Bullish Correction

Wheat Commodity Elliott Wave Technical Analysis Indicates the End of a Long-term Bearish Cycle and an Upcoming Bullish Correction

Elliott Wave analysis of wheat prices indicates the end of a long-term bearish cycle and an upcoming...

Read More >
Euro/ U.S. Dollar Elliott Wave Analysis: Structured Framework for Analyzing Potential EURUSD Price Action and Trading Opportunities

Euro/ U.S. Dollar Elliott Wave Analysis: Structured Framework for Analyzing Potential EURUSD Price Action and Trading Opportunities

EURUSD Elliott Wave analysis indicates a bullish trend, with Navy Blue Wave 1 forming within Gray Wa...

Read More >
Elliott Wave Insights & Strategies SP500, NASDAQ, DAX 40, FTSE 100, ASX200

Elliott Wave Insights & Strategies SP500, NASDAQ, DAX 40, FTSE 100, ASX200

Elliott Wave Analysis Update: Gain insight into market trends and timing with our analysis of the El...

Read More >
 GBPJPY Elliott Wave Technical Analysis - Offering Valuable Technical Perspectives for British Pound/Japanese Yen Currency Pairs

GBPJPY Elliott Wave Technical Analysis - Offering Valuable Technical Perspectives for British Pound/Japanese Yen Currency Pairs

This article provides an in-depth Elliott Wave analysis of the GBPJPY market, highlighting key wave ...

Read More >
Iron Ore (SGX TSI Index Futures) Elliott Wave Analysis covers key Market Movements, Recent Corrections and Projected Future Trends

Iron Ore (SGX TSI Index Futures) Elliott Wave Analysis covers key Market Movements, Recent Corrections and Projected Future Trends

This article provides an in-depth Elliott Wave analysis of the SGX TSI Iron Ore Index, offering valu...

Read More >

$1 for 2 Weeks

then $29 a month!

What a Special Offer!

Trade Recommendations

Unleash the power of deversified trading with our comprehensive portfolio, covering 250+ markets:

  • Stock Trades
  • Crypto Trades
  • Forex Trades
  • Commodity Trades
Elliott Wave Analysis

Gain a competitive edge with expert insights and AI-powered Elliott Wave charting into:

  • Global Indices
  • US Stocks & ASX Stocks
  • Forex & Crypto
  • Commodities
Top-Notch Trading Tools

Equip yourself with the tools of success:

  • Real-time Chat rooms
  • Elliott Wave Algorithm
  • Portfolio tools
  • TradingLevels
  • Screener
  • Trading Game
7 Elliott Wave Analysts

Stay ahead of the market with daily charts and insightful videos
Your secret to strategic trading!

JOIN HERE


Welcome to TradingLounge (ASIC A.R.No. 321187), specialists in trades, trading education and technical analysis, covering stocks, indices, commodities, forex and cryptocurrencies.

When you join TradingLounge you have access to everything we offer, including trade tools, educational content and a social platform to chat with like-minded investors.

Read more

@Copyright 2024 by tradinglounge.com

Contact Us

Australian no: 02 4787 6020

International no: +61 (2) 47876020

Pay with:

Find us on