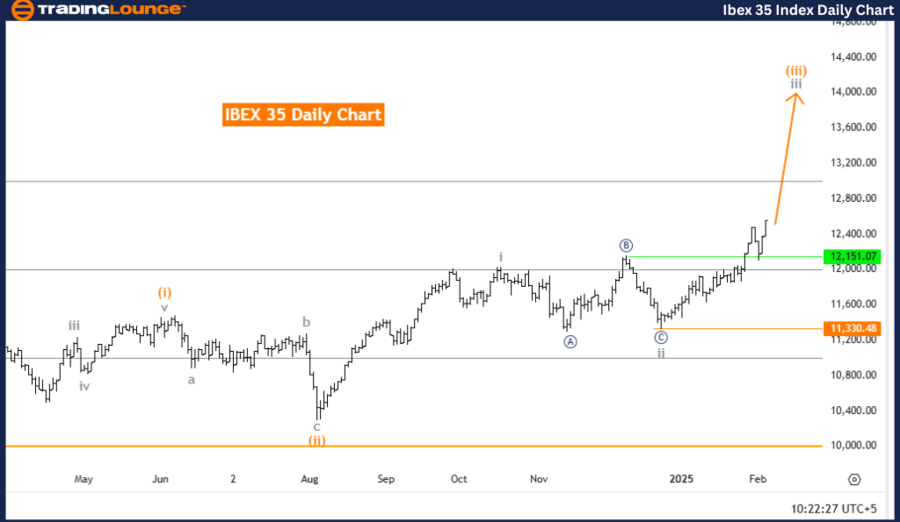
IBEX 35 (Spain) Elliott Wave Analysis - Trading Lounge Day Chart
IBEX 35 (Spain) Day Chart Analysis
IBEX 35 Elliott Wave Technical Analysis
-
Function: Bullish Trend
-
Mode: Impulsive
-
Structure: Gray wave 3
-
Position: Orange wave 3
-
Direction Next Higher Degrees: Gray wave 3 (initiated)
-
Details: The gray wave 2 has likely concluded, and now gray wave 3 of orange wave 3 is in progress.
Wave Cancel Invalidation Level: 11,330.48
IBEX 35 Analysis Overview
The IBEX 35 daily chart indicates a bullish trend based on Elliott Wave Theory, currently in an impulsive phase. The ongoing wave structure highlights gray wave 3 developing within orange wave 3, suggesting continued upward market momentum.
With gray wave 2 completed, the market is now in gray wave 3, a phase known for its strong and sustained bullish price action. According to Elliott Wave principles, wave 3 is typically the most powerful phase of an uptrend, potentially leading to high market activity and trading opportunities.
The wave cancel invalidation level at 11,330.48 acts as a critical confirmation point. If the price declines below this level, the current wave count would be invalidated, necessitating a reevaluation of the bullish scenario.
Conclusion
The IBEX 35 daily chart reflects a positive market outlook, with gray wave 3 progressing within orange wave 3. The completion of gray wave 2 strengthens the probability of further upside movement.
Traders should stay vigilant by monitoring price action and key technical levels, ensuring alignment with the bullish Elliott Wave structure for optimal trading opportunities.
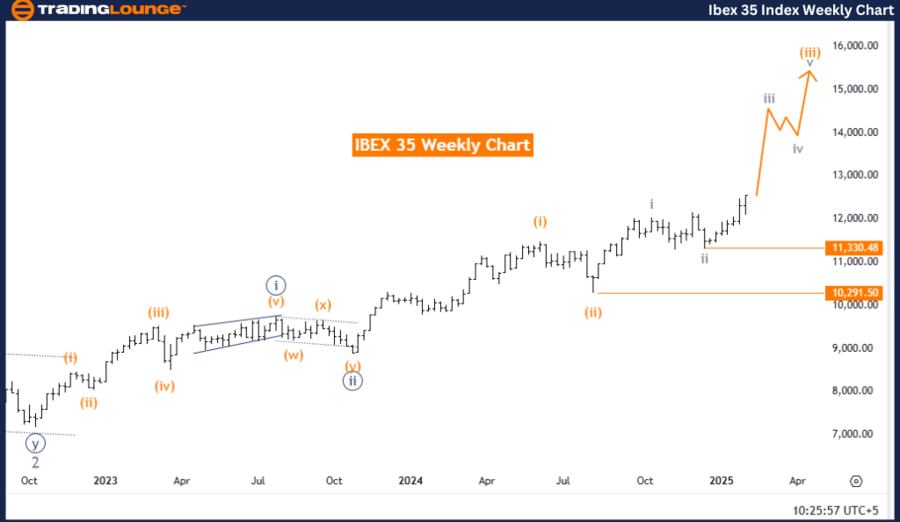
IBEX 35 (Spain) Elliott Wave Analysis - Trading Lounge Weekly Chart
IBEX 35 (Spain) Elliott Wave Technical Analysis
-
Function: Bullish Trend
-
Mode: Impulsive
-
Structure: Gray wave 3
-
Position: Orange wave 3
-
Direction Next Lower Degrees: Gray wave 4
-
Details:
The gray wave 2 appears to have completed, and gray wave 3 of orange wave 3 is currently unfolding.
-
Wave Cancel Invalidation Level: 11,330.48
IBEX 35 Analysis Overview
The IBEX 35 weekly chart reinforces a bullish market outlook under Elliott Wave Theory, currently in an impulsive phase. The ongoing structure highlights gray wave 3 within orange wave 3, pointing toward sustained upward market momentum.
With gray wave 2 completed, the market has transitioned into gray wave 3, often regarded as the strongest phase in an uptrend. Historically, wave 3 represents significant price appreciation, making it a key opportunity zone for traders.
After gray wave 3 completes, the market is expected to enter gray wave 4, a phase likely to introduce short-term corrections or consolidation before resuming its bullish trajectory. Traders should anticipate this phase and adjust their strategies accordingly.
The wave cancel invalidation level remains at 11,330.48. If the market breaks below this threshold, the current Elliott Wave structure would require reassessment. Monitoring this level is essential to validate ongoing bullish sentiment.
Conclusion
The IBEX 35 weekly chart presents a strong bullish outlook, with gray wave 3 advancing within orange wave 3. The completion of gray wave 2 further supports the potential for continued gains.
However, traders should prepare for gray wave 4, which may introduce short-term corrections. Close monitoring of the 11,330.48 invalidation level will help traders adapt effectively to market movements.
Technical Analyst: Malik Awais
Source: visit Tradinglounge.com and learn From the Experts Join TradingLounge Here
Previous: NIFTY 50 Elliott Wave Technical Analysis
VALUE Offer - Buy 1 Month & Get 3 Months!Click here
Access 7 Analysts Over 200 Markets Covered. Chat Room With Support