06Feb

NIFTY 50 INDEX Elliott Wave Technical Analysis: Indian Stock Market Outlook Progressing Toward the 25,000-25,100 Range

NIFTY 50 INDEX Elliott Wave Analysis - TradingLounge (1D Chart)

NIFTY 50 INDEX Day Chart Analysis

Function: Counter Trend (Minor Degree, Grey)

Mode: Corrective

Structure: Impulse within a Larger Degree

Position: Minute Wave ((ii))

NIFTY 50 Elliott Wave Technical Analysis & Elliott Wave Outlook

  • Current Projection: The NIFTY 50 Index is forming a corrective wave pattern, with Minute Wave ((ii)) potentially advancing towards the 25,000 range before the downtrend resumes.

  • Wave Structure: The correction is developing as an expanded flat, which aligns with broader Elliott Wave principles.
  • Alternative Scenario: The entire structure from the 26,300 high may be progressing as a Minute-degree correction.

Invalidation Level: 26,400

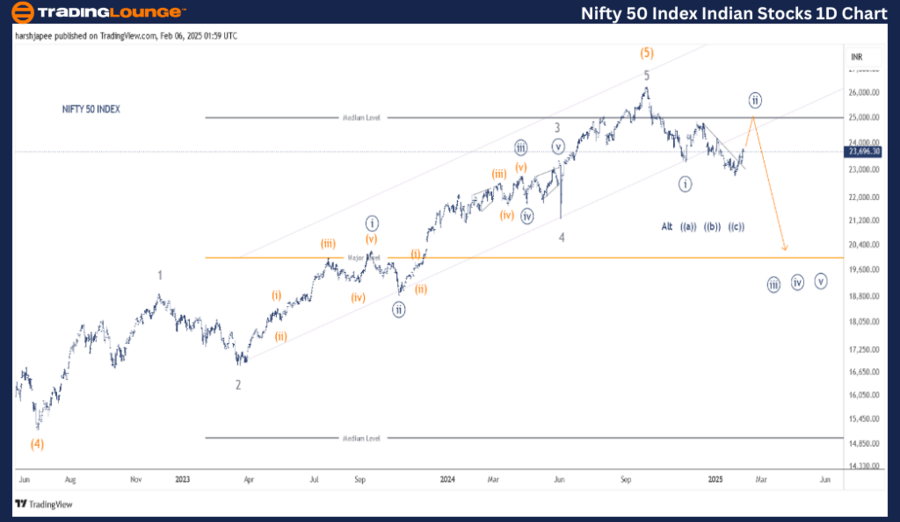
NIFTY 50 INDEX Daily Chart – Elliott Wave Analysis & Forecast

  • The NIFTY 50 Index marked a major top near 26,300 in September 2024 and subsequently reversed. This decline formed Minute Wave ((i)), reaching the 23,267 level before unfolding into a possible expanded flat corrective wave targeting the 25,000-25,100 range.
  • Intermediate Wave (4) completed around 15,200 in June 2022. Following this, bulls triggered a strong Minor-degree rally (Waves 1-5), leading to the recent peak at 26,300 before the correction began.

NIFTY-50-INDEX-India...


NIFTY 50 INDEX – NIFTY (4H Chart) Elliott Wave Technical Analysis

Function: Counter Trend (Minor Degree, Grey)

Mode: Corrective

Structure: Impulse within a Larger Degree

Position: Minute Wave ((ii))

NIFTY 50 Technical Analysis & Elliott Wave Outlook

  • Current Projection: Minute Wave ((ii)) appears to be progressing towards 25,000, indicating a temporary corrective phase before the downtrend continues.
  • Wave Structure: The correction is evolving as an expanded flat, labeled Minuette (a)-(b)-(c) on the 4H chart.
  • Alternative Scenario: The full move from the 26,300 high could be forming a Minute-degree correction ((a))-((b))-((c)) instead.

Invalidation Level: 26,400

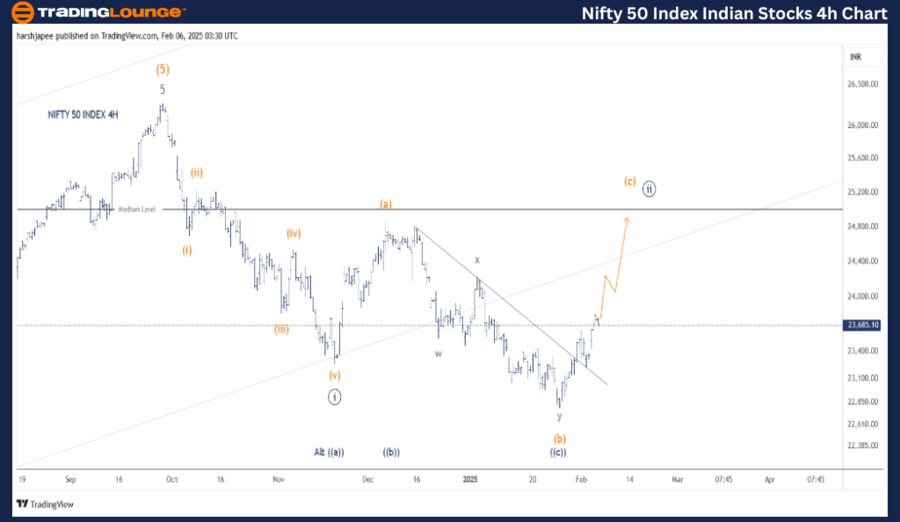
NIFTY 50 INDEX 4H Chart – Elliott Wave Counts & Projections

  • The NIFTY 50 Index rallied to 26,280-26,300 on September 27, 2024, before reversing lower. The initial drop to 23,267 subdivided into five waves, classified as Minute Wave ((i)).
  • The subsequent price action is unfolding as a potential expanded flat (a)-(b)-(c), with prices likely moving towards the 25,000-25,100 region.
  • A break above 24,255 would confirm further bullish momentum in the near term.
  • Alternatively, the entire movement from 26,300 highs could be unfolding as a corrective wave ((a))-((b))-((c)), indicating possible bullish control soon.

Technical Analyst: Harsh Japee

Source: visit Tradinglounge.com and learn From the Experts Join TradingLounge Here 

Previous:  NIFTY 50 Elliott Wave Technical Analysis

VALUE Offer - Buy 1 Month & Get 3 Months!Click here

Access 7 Analysts Over 200 Markets Covered. Chat Room With Support

NIFTY-50-INDEX-India...


Conclusion

The NIFTY 50 Index is currently advancing towards the 25,000-25,100 zone as part of Minuette Wave (c) (Orange), which could complete Minute Wave ((ii)) before the broader downtrend resumes.

Related

Comprehensive Elliott Wave Analysis of TJX Companies Inc. with Daily and 1-Hour Chart Insights and Stock Projections

Comprehensive Elliott Wave Analysis of TJX Companies Inc. with Daily and 1-Hour Chart Insights and Stock Projections

This Elliott Wave analysis of TJX Companies Inc. (TJX) provides a detailed look at daily and 1-hour ...

Read More >
U.S. Dollar/Japanese Yen Forex Elliott Wave Technical Analysis: Watch for Optimal USDJPY Trading Insights.

U.S. Dollar/Japanese Yen Forex Elliott Wave Technical Analysis: Watch for Optimal USDJPY Trading Insights.

This analysis of USDJPY offers a comprehensive look at the Elliott Wave forecast, examining current ...

Read More >
DOW JONES – DJI Index Elliott Wave Forecast Shows Bullish Trend with Wave Count Analysis and Key Invalidation Level at 36,642

DOW JONES – DJI Index Elliott Wave Forecast Shows Bullish Trend with Wave Count Analysis and Key Invalidation Level at 36,642

Dow Jones analysis applies Elliott Wave Theory to identify a strong bullish trend, with active impul...

Read More >
Stay informed about Wheat Commodity Market with Wheat Elliott Wave Technical Analysis

Stay informed about Wheat Commodity Market with Wheat Elliott Wave Technical Analysis

Our detailed wheat Elliott Wave analysis provides insights into wheat price forecasts and market tre...

Read More >
CSX Corp. (CSX) U.S. Stocks Elliott Wave Technical Daily & 1‑Hour Analysis: Wave 3 Bullish, $33 Top, $30 Retracement Setup

CSX Corp. (CSX) U.S. Stocks Elliott Wave Technical Daily & 1‑Hour Analysis: Wave 3 Bullish, $33 Top, $30 Retracement Setup

This CSX Elliott Wave analysis covers both daily and 1‑hour charts. On the daily timeframe, CSX is ...

Read More >
CIPLA Stock Analysis: Elliott Wave Forecast Reveals Corrective Wave Opportunities, Share Price Targets, and Key Trading Strategies

CIPLA Stock Analysis: Elliott Wave Forecast Reveals Corrective Wave Opportunities, Share Price Targets, and Key Trading Strategies

CIPLA’s stock trend using Elliott Wave Theory. Explore corrective wave structures, forecasted share...

Read More >

$1 for 2 Weeks

then $29 a month!

What a Special Offer!

Trade Recommendations

Unleash the power of deversified trading with our comprehensive portfolio, covering 250+ markets:

  • Stock Trades
  • Crypto Trades
  • Forex Trades
  • Commodity Trades
Elliott Wave Analysis

Gain a competitive edge with expert insights and AI-powered Elliott Wave charting into:

  • Global Indices
  • US Stocks & ASX Stocks
  • Forex & Crypto
  • Commodities
Top-Notch Trading Tools

Equip yourself with the tools of success:

  • Real-time Chat rooms
  • Elliott Wave Algorithm
  • Portfolio tools
  • TradingLevels
  • Screener
  • Trading Game
7 Elliott Wave Analysts

Stay ahead of the market with daily charts and insightful videos
Your secret to strategic trading!

JOIN HERE


Welcome to TradingLounge (ASIC A.R.No. 321187), specialists in trades, trading education and technical analysis, covering stocks, indices, commodities, forex and cryptocurrencies.

When you join TradingLounge you have access to everything we offer, including trade tools, educational content and a social platform to chat with like-minded investors.

Read more

@Copyright 2024 by tradinglounge.com

Contact Us

Australian no: 02 4787 6020

International no: +61 (2) 47876020

Pay with:

Find us on