13Mar

S&P BSE Sensex Elliott Wave Analysis: Trading Strategies & Price Predictions for Smart Investors and Traders in the Indian Stock Market

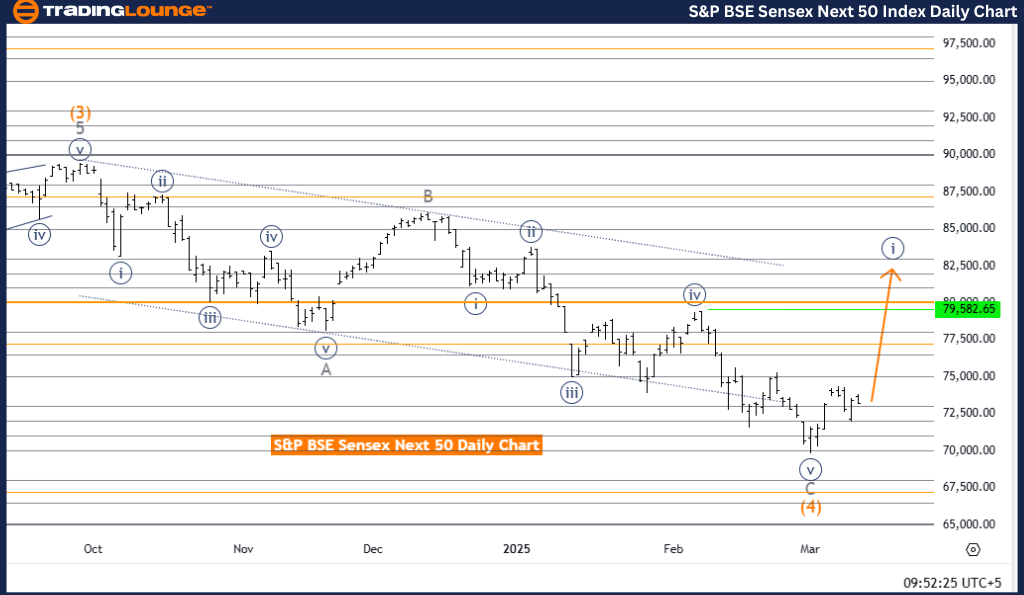
S&P BSE Sensex (India) Elliott Wave Analysis – Trading Lounge Day Chart

S&P BSE Sensex (India) Day Chart Analysis

S&P BSE Sensex (India) Wave Technical Analysis

Function: Bullish Trend

Mode: Impulsive

Structure: Navy Blue Wave 1

Position: Gray Wave 1

Next Higher Degree Direction: Navy Blue Wave 1 (Started)

S&P BSE Sensex Analysis Overview

The S&P BSE Sensex India Elliott Wave Analysis on the daily chart confirms a strong bullish trend, indicating upward momentum. The market is currently developing an impulsive wave, with Navy Blue Wave 1 forming within a larger wave structure. This wave is positioned within Gray Wave 1, reinforcing the emerging trend in the market.

This analysis suggests that a new bullish trend has begun, led by Navy Blue Wave 1. As this wave represents the initial phase of a larger uptrend, further market gains are likely. Additionally, the next higher-degree wave (Navy Blue Wave 1) has already started, strengthening the bullish outlook.

Key Trading Insights

✔ Wave 1 in an impulsive sequence often sets the foundation for further price increases.
✔ Market corrections during this phase can offer strategic entry points for traders.
✔ The current strong uptrend in S&P BSE Sensex suggests potential long-term growth.

The bullish Elliott Wave structure signals continued upside potential, with Wave 1 actively developing. Traders should closely monitor price movements and wave formations to identify optimal trading opportunities.

S&P-BSE-Sensex-next-...


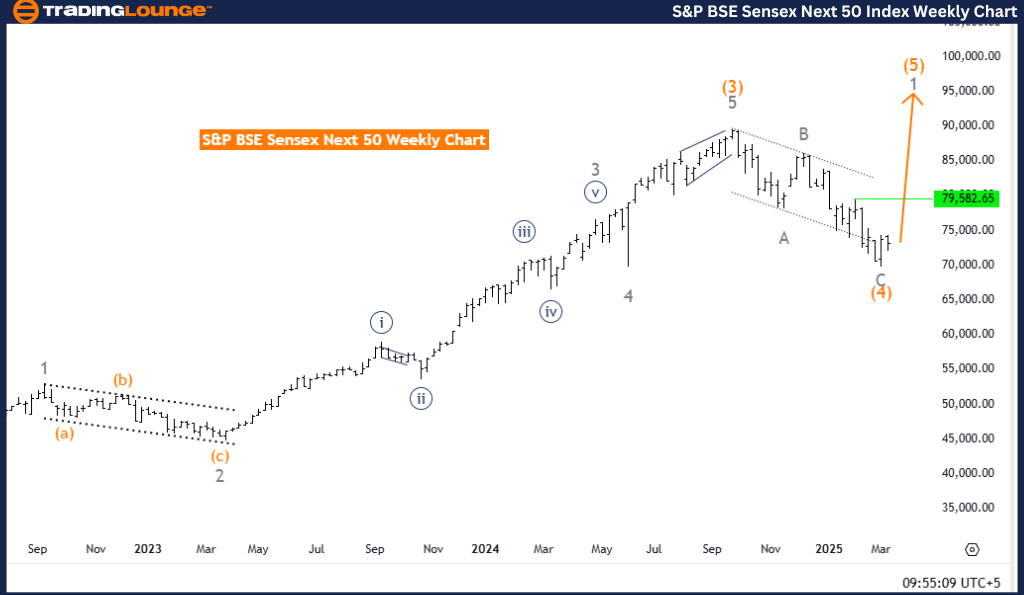
S&P BSE Sensex (India) Elliott Wave Analysis – Trading Lounge Weekly Chart

S&P BSE Sensex (India) Wave Technical Analysis

Function: Bullish Trend

Mode: Impulsive

Structure: Gray Wave 1

Position: Orange Wave 5

Next Higher Degree Direction: Gray Wave 1 (Started)

S&P BSE Sensex (India) Analysis Overview

The S&P BSE Sensex India Elliott Wave Analysis on the weekly chart confirms a bullish market structure, reflecting strong upward momentum. The market remains in an impulsive phase, with Gray Wave 1 actively developing within Orange Wave 5.

The analysis indicates that the previous corrective phase (Orange Wave 4) has likely concluded, allowing the market to progress into Gray Wave 1 of Orange Wave 5. Since Wave 5 often marks the final phase of an impulsive sequence, further market gains are expected before a potential long-term correction.

Key Trading Insights

✔ Wave 1 within Wave 5 signals the early stages of a new bullish movement.
✔ This phase presents opportunities for strategic trade entries.
✔ Traders should closely watch key resistance levels to confirm trend continuation.

Currently, the S&P BSE Sensex is maintaining a strong uptrend, with Wave 1 of Wave 5 actively unfolding. The bullish Elliott Wave structure suggests further growth potential. Monitoring market behavior and wave progressions will be crucial for making well-informed trading decisions in this ongoing uptrend.

Technical Analyst: Malik Awais

Source: Visit Tradinglounge.com and learn from the Experts. Join TradingLounge Here 

Previous: Shanghai Composite Index Elliott Wave Technical Analysis

VALUE Offer - Buy 1 Month & Get 3 Months!Click here

Access 7 Analysts Over 200 Markets Covered. Chat Room With Support

S&P-BSE-Sensex-next-...

Related

Dogecoin Crypto Price News Today - Elliott Wave Analysis of Dogecoin/USD (DOGEUSD) A Comprehensive Guide

Dogecoin Crypto Price News Today - Elliott Wave Analysis of Dogecoin/USD (DOGEUSD) A Comprehensive Guide

This article offers a comprehensive look at the Dogecoin (DOGEUSD) market through the lens of Elliot...

Read More >
British Pound/U.S.Dollar (GBPUSD) Elliott Wave Technical Analysis 11 January 24

British Pound/U.S.Dollar (GBPUSD) Elliott Wave Technical Analysis 11 January 24

British Pound/U.S.Dollar (GBPUSD) Elliott Wave Technical Analysis 11 January 24 provides an in-depth...

Read More >
Ethereum ETF (ETHE) Elliott Wave 3 Forecast: Breakout Rally Toward $26 with Trading Strategy and Risk Invalidation Guidance

Ethereum ETF (ETHE) Elliott Wave 3 Forecast: Breakout Rally Toward $26 with Trading Strategy and Risk Invalidation Guidance

ETHE has entered a powerful Wave 3 phase per Elliott Wave theory, targeting new highs with a project...

Read More >
XRP Price Prediction: Elliott Wave Signals Bullish Breakout to $3.88 with Key Fibonacci Zones for Swing Trade Opportunities

XRP Price Prediction: Elliott Wave Signals Bullish Breakout to $3.88 with Key Fibonacci Zones for Swing Trade Opportunities

Analyse XRP's Elliott Wave setup with forecasts showing a bullish breakout to $3.88. Includes Fi...

Read More >
Bharat Electronics Elliott Wave Analysis: Stock Forecast, Market Trends, and Price Prediction Using Elliott Wave Theory

Bharat Electronics Elliott Wave Analysis: Stock Forecast, Market Trends, and Price Prediction Using Elliott Wave Theory

Bharat Electronics Elliott Wave Analysis provides a detailed technical outlook on the stock’s bulli...

Read More >
MercadoLibre Inc. (MELI) Elliott Wave Analysis Shows Bullish Reversal Setup in Wave (2) With Key Support and Trade Signals

MercadoLibre Inc. (MELI) Elliott Wave Analysis Shows Bullish Reversal Setup in Wave (2) With Key Support and Trade Signals

Elliott Wave breakdown of MercadoLibre Inc. (MELI) explores both daily and intraday charts, indicati...

Read More >

Buy 1 Month

Get 3 Months!

Special Offer:

Trade Recommendations

Unleash the power of deversified trading with our comprehensive portfolio, covering:

  • Stock Trades
  • Crypto Trades
  • Forex Trades
  • Commodity Trades
Elliott Wave Analysis

Gain a competive edge with expert insights in to:

  • Global Indices
  • US Stocks & ASX Stocks
  • Forex & Crypto
  • Commodities
Top-Notch Trading Tools

Equip yourself with the tools of success:

  • Social Chat
  • Elliott Wave Algorithm
  • Screener
  • TradingLevels
  • Trading Game
7 Elliott Wave Analysts

Stay ahead of the market with daily charts and insightful videos
-Your secret to strategic trading!

JOIN HERE


Welcome to TradingLounge (ASIC A.R.No. 321187), specialists in trades, trading education and technical analysis, covering stocks, indices, commodities, forex and cryptocurrencies.

When you join TradingLounge you have access to everything we offer, including trade tools, educational content and a social platform to chat with like-minded investors.

Read more

@Copyright 2024 by tradinglounge.com

Contact Us

Australian no: 02 4787 6020

International no: +61 (2) 47876020

Pay with:

Find us on