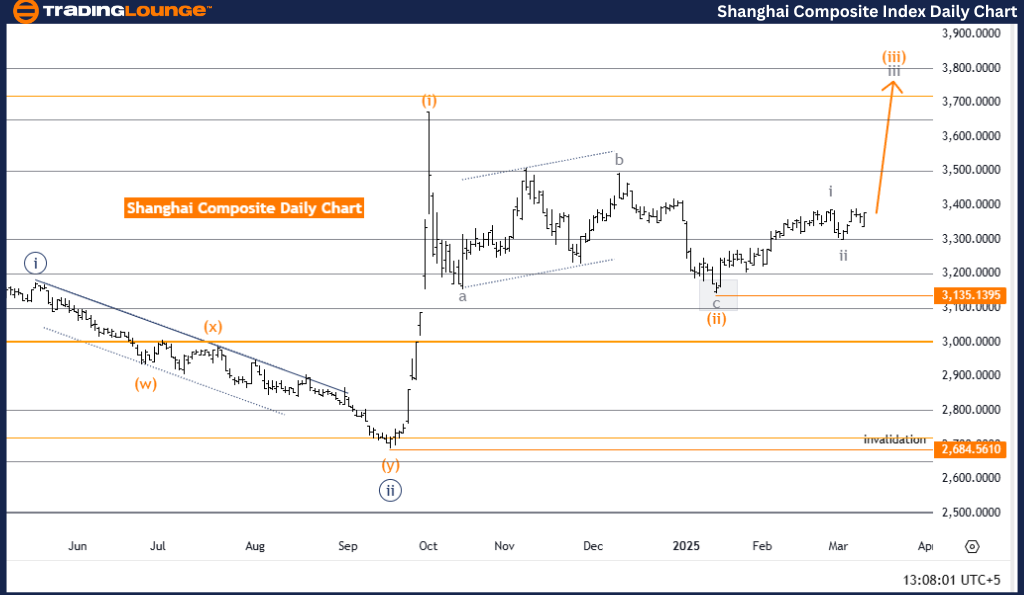
Shanghai Composite Elliott Wave Analysis – Trading Lounge Day Chart
Shanghai Composite Elliott Wave Technical Analysis
Technical Analysis Overview
Function: Trend
Mode: Impulsive
Structure: Gray Wave 3
Position: Orange Wave 3
Next Higher Degree Direction: Gray Wave 3 (Started)
Wave Cancellation Invalid Level: 3135.1395
Shanghai Composite Analysis Details
The Shanghai Composite Elliott Wave Analysis for the daily chart highlights a strong uptrend, with the market currently in an impulsive phase. The ongoing wave structure is gray wave 3, which forms part of the larger orange wave 3. This indicates a bullish continuation, characteristic of Elliott Wave impulsive structures.
The next higher-degree wave, gray wave 3, has already begun and is expected to push prices further upward, aligning with the broader trend. The completion of gray wave 2 suggests the market has entered a new bullish phase, and traders should track the progress of gray wave 3, as its development will provide insights into the next market cycle.
Key Level to Watch
A critical support level to monitor is 3135.1395. If the price falls below this invalidation level, the current wave count would no longer be valid, requiring a reassessment of the Elliott Wave structure. This level serves as strong support, and a break below it could signal a potential trend reversal or wave structure modification.
Conclusion
The Shanghai Composite Index remains in a strong bullish trend, with gray wave 3 in progress following the completion of gray wave 2. As part of orange wave 3, this movement is expected to continue pushing prices higher.
Traders should closely monitor gray wave 3, as its evolution will provide key insights into the direction and timing of the next major market move. Understanding Elliott Wave structures will help anticipate market movements and refine trading strategies accordingly.
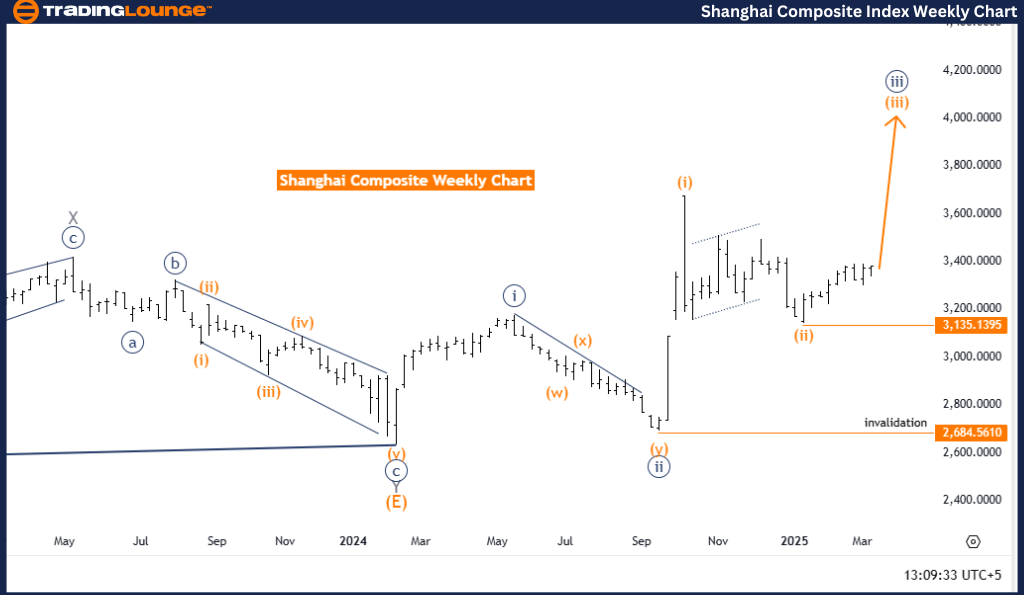
Shanghai Composite Elliott Wave Analysis – Trading Lounge Weekly Chart
Shanghai Composite Elliott Wave Technical Analysis
Technical Analysis Overview
Function: Trend
Mode: Impulsive
Structure: Orange Wave 3
Position: Navy Blue Wave 3
Next Higher Degree Direction: Orange Wave 3 (Started)
Wave Cancellation Invalid Level: 3135.1395
Analysis Details: The Shanghai Composite Elliott Wave Analysis for the weekly chart continues to highlight a strong bullish trend, with the market in an impulsive phase. The ongoing wave structure is identified as orange wave 3, forming part of the larger navy blue wave 3. This suggests a sustained bullish phase, characteristic of Elliott Wave impulse waves.
The next significant move in the higher-degree structure is the continuation of orange wave 3, which has already started and is expected to drive prices further upward, reinforcing the broader uptrend.
The completion of orange wave 2 indicates that the market has transitioned into orange wave 3, which is expected to maintain strong bullish momentum. Traders should carefully observe the progress of orange wave 3, as it will signal a key market turning point and provide valuable insights for strategic positioning.
Key Level to Watch
The wave cancellation invalid level to watch remains 3135.1395. If the price declines below this level, the current wave count will be invalidated, prompting a reevaluation of the Elliott Wave structure. This price level acts as a strong support zone, and any breach may indicate a shift in trend or a potential correction.
Conclusion
The Shanghai Composite Index remains in a bullish trend, with orange wave 3 now developing after the completion of orange wave 2. This impulsive movement, which is part of navy blue wave 3, is expected to drive continued upward momentum.
Traders should closely follow the progress of orange wave 3, as it will provide key insights into future price movements and market direction. Understanding Elliott Wave structures can help forecast potential market moves and refine trading strategies accordingly.
Technical Analyst: Malik Awais
Source: Visit Tradinglounge.com and learn from the Experts. Join TradingLounge Here
Previous: DOW JONES Elliott Wave Technical Analysis
VALUE Offer - Buy 1 Month & Get 3 Months!Click here
Access 7 Analysts Over 200 Markets Covered. Chat Room With Support