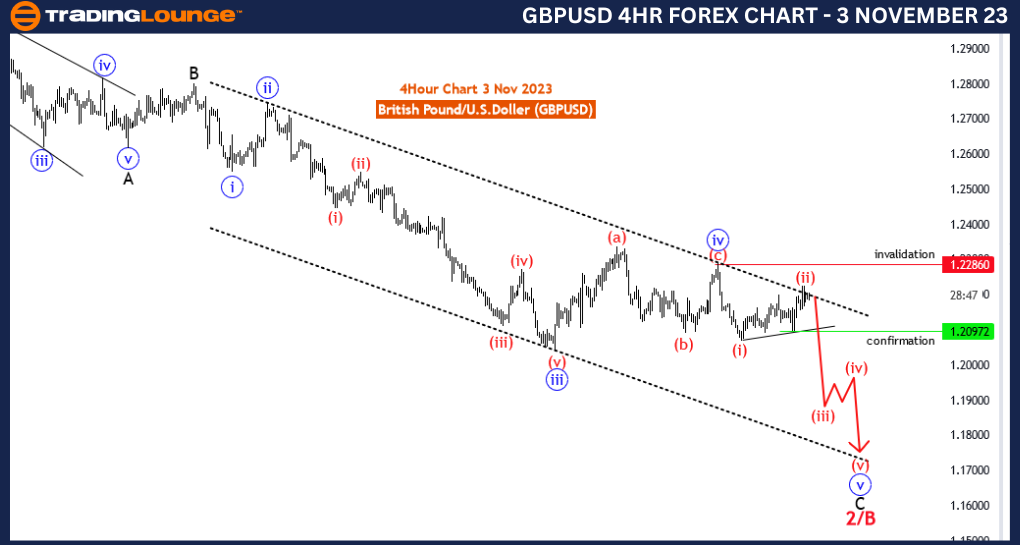
GBPUSD Elliott Wave Analysis Trading Lounge 4 Hour Chart, 3 November 23
British Pound/U.S.Dollar (GBPUSD) 4 Hour Chart
GBPUSD Elliott Wave Technical Analysis
Function:Counter Trend
Mode: impulsive
Structure: wave 5 of C
Position: 2/B
Direction;Next Lower Degrees: wave 5 of C (started)
Details: blue wave 4 of black wave C completed at 1.22860 . Now blue wave 5 of C is in play . Wave Cancel invalid level: 1.22860
The "GBPUSD Elliott Wave Analysis Trading Lounge 4 Hour Chart" dated 3 November 23, offers insights into the British Pound/U.S. Dollar (GBP/USD) currency pair's recent price movements. This analysis is essential for traders and investors seeking to understand the current market dynamics.
The analysis characterizes the market's primary function as "Counter Trend." This designation suggests that the market may be undergoing a counter-trend phase, which is a temporary reversal in the price direction within a broader trend.
The "Mode" is described as "impulsive." In Elliott Wave theory, an impulsive wave typically indicates strong, sustained price movements in the direction of the prevailing trend. This implies that, within the counter-trend structure, there is an impulsive sub-wave in progress.
The central focus of this analysis is on "blue wave 5 of C." In Elliott Wave theory, wave counting is used to identify price patterns and trends. This specific sub-wave (wave 5 of C) is currently in play and is part of the larger corrective wave (C).
It is highlighted that "blue wave 4 of black wave C" has concluded at 1.22860. This suggests that a corrective phase, wave 4, within the broader black wave C has been completed. Following the completion of wave 4, the market has entered "blue wave 5 of C."
The "Wave Cancel invalid level" is specified as 1.22860. This level is significant as it serves as a reference point for risk management. If the market approaches or surpasses this level, it might indicate a potential invalidation of the current wave count and could necessitate a reevaluation of trading strategies.
In summary, the GBP/USD Elliott Wave Analysis on the 4-hour chart dated 3 November 23, provides important information for traders. It signals the commencement of an impulsive sub-
wave (blue wave 5 of C) within the broader counter-trend structure. Traders should keep a close eye on the wave cancel invalid level for effective risk management. This analysis is particularly valuable for those looking to capitalize on trading opportunities in the GBP/USD currency pair.
Technical Analyst: Malik Awais
Source: Tradinglounge.com get trial here!
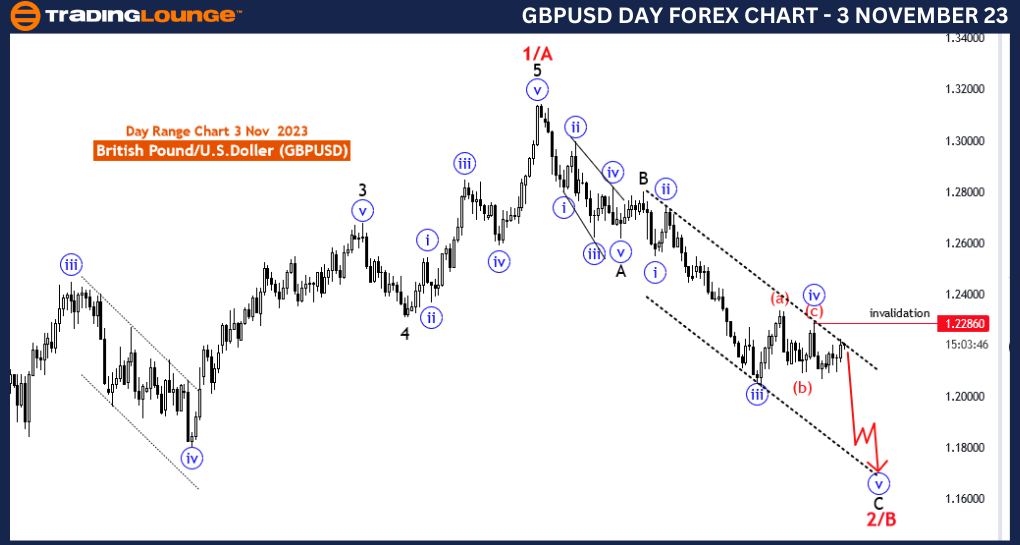
GBPUSD Elliott Wave Analysis Trading Lounge Day Chart, 3 November 23
British Pound/U.S.Dollar (GBPUSD) Day Chart
GBPUSD Elliott Wave Technical Analysis
Function: Counter Trend
Mode: impulsive
Structure: wave 5 of C
Position: 2/B
Direction; Next Higher Degrees: new uptrend
Details: blue wave 4 of black wave C completed at 1.22860 . Now blue wave 5 of C is in play . Wave Cancel invalid level: 1.22860
The "GBPUSD Elliott Wave Analysis Trading Lounge Day Chart" dated 3 November 23, provides a comprehensive outlook for the British Pound/U.S. Dollar (GBP/USD) currency pair's price movements on a daily chart. It serves as a valuable resource for traders and investors aiming to make informed decisions based on Elliott Wave analysis.
The analysis classifies the primary function of the market as "Counter Trend." This indicates that the GBP/USD pair is currently undergoing a temporary reversal within the broader market trend. In this context, it's crucial to examine potential upcoming movements in the opposite direction.
The "Mode" is characterized as "impulsive." An impulsive mode in Elliott Wave analysis typically suggests a strong, sustained price movement in the direction of the prevailing trend. In this case, the impulsive movement is designated as "blue wave 5 of C."
The core of this analysis is focused on "blue wave 4 of black wave C," which has been identified as completed at the price level of 1.22860. This signals the termination of wave 4, which is part of the broader black wave C. Consequently, the market has transitioned into "blue wave 5 of C."
What makes this analysis particularly noteworthy is its prediction of a significant shift in market direction. The "Direction" is stated as "Next Higher Degrees: new uptrend." This implies that, after the completion of wave 4, the GBP/USD market is anticipated to enter a new upward trend.
The "Wave Cancel invalid level" is indicated as 1.22860. This level holds paramount importance for traders as it defines a key threshold for risk management. If the market approaches or surpasses this level, it might signify a potential invalidation of the current wave count and could necessitate a reassessment of trading strategies.
In conclusion, the GBP/USD Elliott Wave Analysis on the daily chart, dated 3 November 23, conveys an impending market shift. Following the completion of wave 4 of black wave C, the GBP/USD currency pair is expected to embark on a new uptrend. Traders should closely monitor the wave cancel invalid level for effective risk management. This analysis serves as a critical resource for market participants aiming to seize trading opportunities within the GBP/USD market.
Technical Analyst: Malik Awais
Source: Tradinglounge.com get trial here!