10Apr

CAC 40 Elliott Wave Forecast with Daily and Weekly Chart Analysis Highlighting Corrective Wave Structure and France Stock Market

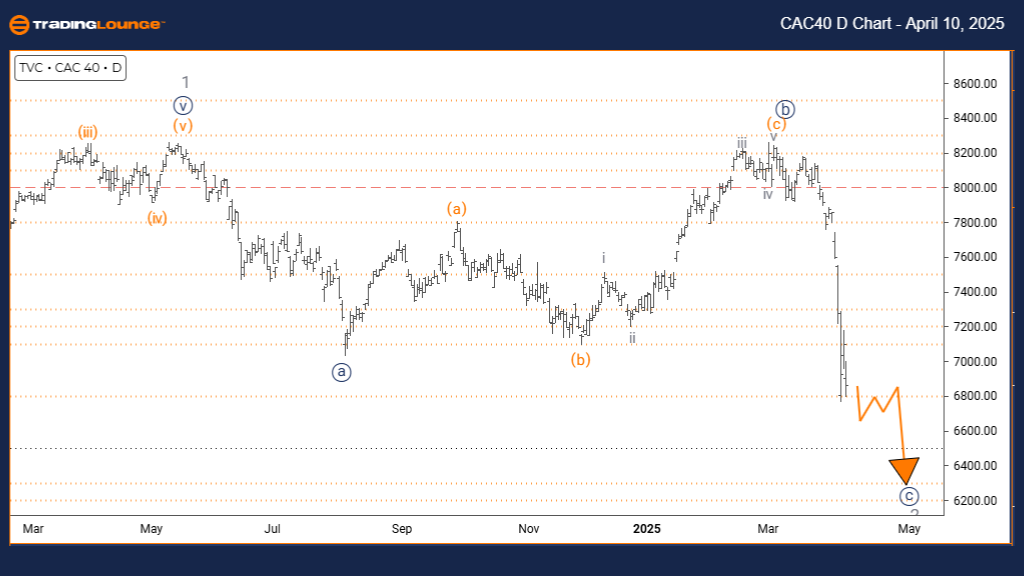
CAC 40 (France) Elliott Wave Analysis | Trading Lounge Daily Chart

CAC 40 (France) Index Daily Chart Forecast

CAC 40 (France) Elliott Technical Wave Analysis

FUNCTION: Counter-Trend

MODE: Corrective

STRUCTURE: Navy blue wave C

POSITION: Gray wave 2

DIRECTION NEXT HIGHER DEGREES: Navy blue wave 1 of 3

DETAILS: Navy blue wave B is likely complete; navy blue wave C of 2 is now unfolding.

The Elliott Wave forecast for the CAC 40 Index on the daily chart indicates a developing corrective counter-trend move. Currently, navy blue wave C is unfolding as part of the broader gray wave 2 corrective structure. With navy blue wave B appearing complete, the index is progressing through wave C of this correction.

This daily analysis provides traders with key insight into the CAC 40’s position within the larger Elliott Wave cycle. Wave C’s active development signals a temporary deviation from the main bullish trend. Upon completion of this corrective wave, the market is projected to begin navy blue wave 1 of 3, aligning with a bullish continuation.

Wave hierarchy is crucial in this phase, as navy blue wave C represents a medium-term corrective move within a larger bullish context. Traders should monitor for classic corrective patterns like ABC formations or lateral consolidation, which are typical in counter-trend markets.

This current structure presents opportunities for both short-term retracement trades and strategic long-term entries. Confirmation of wave C’s end will be key to positioning for the next impulsive move higher.

CAC-40-index-Day-Cha...


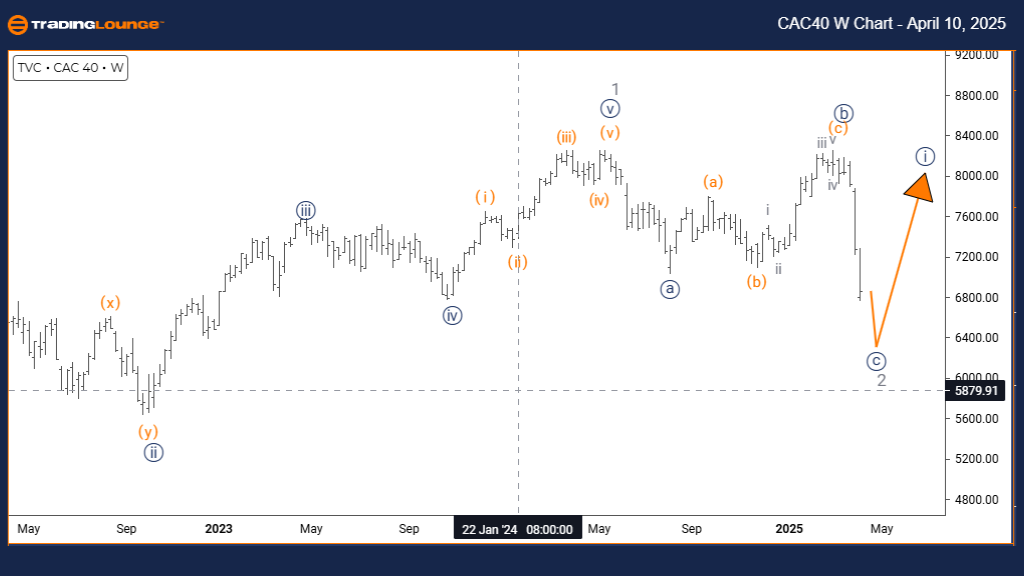
CAC 40 (France) Elliott Wave Analysis | Trading Lounge Weekly Chart

CAC 40 (France) Long-Term Wave Structure

FUNCTION: Counter-Trend

MODE: Corrective

STRUCTURE: Navy blue wave C

POSITION: Gray wave 2

DIRECTION NEXT HIGHER DEGREES: Navy blue wave 1 of 3

DETAILS: Navy blue wave B looks complete; navy blue wave C of 2 is currently active.

The weekly Elliott Wave analysis of the CAC 40 Index presents a larger-scale corrective counter-trend pattern. The main structure, navy blue wave C, continues to evolve as part of gray wave 2. With wave B now considered complete, wave C is underway in this broader corrective phase.

From a macro view, the weekly chart helps identify the CAC 40’s position within its long-term Elliott Wave structure. The active correction in wave C of 2 reflects a pause in the primary trend, with expectations of transitioning into navy blue wave 1 of 3 once this move completes.

This chart underscores the significance of wave degree relationships, with navy blue wave C offering a medium-term trading setup within the overarching bullish scenario. Traders should watch for standard corrective wave features such as three-wave structures or price consolidation, which frequently signal counter-trend developments.

This Elliott Wave setup is ideal for swing and position traders awaiting confirmation before committing to directional trades. The weekly perspective is essential for aligning short-term strategies with long-term bullish opportunities once wave C concludes.

Technical Analyst: Malik Awais

Source: visit Tradinglounge.com and learn from the Experts. Join TradingLounge Here 

Previous: TASI INDEX Elliott Wave Technical Analysis

VALUE Offer - Buy 1 Month & Get 3 Months!Click here

Access 7 Analysts Over 200 Markets Covered. Chat Room With Support

CAC-40-index-weekly-...

Related

Berkshire Hathaway Inc. (BRK.B) Elliott Wave Analysis: Stock Forecast, Trend Outlook, and Technical Analysis for Bullish Momentum

Berkshire Hathaway Inc. (BRK.B) Elliott Wave Analysis: Stock Forecast, Trend Outlook, and Technical Analysis for Bullish Momentum

Berkshire Hathaway (BRK.B) remains in an impulsive Elliott Wave structure, progressing through Wave ...

Read More >
ASX Northern Star Resources Ltd (NST) Elliott Wave Technical Analysis: Stock Forecast and Key Price Targets for Bullish Trends

ASX Northern Star Resources Ltd (NST) Elliott Wave Technical Analysis: Stock Forecast and Key Price Targets for Bullish Trends

Elliott Wave analysis for ASX: Northern Star Resources Ltd (NST), focusing on bullish trends, key pr...

Read More >
S&P 500 Elliott Wave Technical Analysis: Insights on Bullish Trends, Wave Progressions, Risk Management, and Trading Strategies

S&P 500 Elliott Wave Technical Analysis: Insights on Bullish Trends, Wave Progressions, Risk Management, and Trading Strategies

S&P 500 Elliott Wave analysis for both daily and weekly charts highlighting bullish trends and impul...

Read More >
Netflix Inc.(NFLX:NYSE) Elliott Wave Technical Analysis 23 January 24

Netflix Inc.(NFLX:NYSE) Elliott Wave Technical Analysis 23 January 24

TradingLounge 4-hour and 1-hour Chart for Netflix Inc.(NFLX:NYSE) Elliott Wave Technical Analysis da...

Read More >
Analysis of Nestle India (NESTLEIND) Stock uses Elliott Wave theory to Provide a Forecast of the Stock's Future Movements

Analysis of Nestle India (NESTLEIND) Stock uses Elliott Wave theory to Provide a Forecast of the Stock's Future Movements

This analysis of Nestle India (NESTLEIND) uses Elliott Wave theory to provide a comprehensive foreca...

Read More >
McDonald's (MCD) Elliott Wave Analysis: Detailed Stock Forecast with Technical Indicators for Smarter Trading Decisions

McDonald's (MCD) Elliott Wave Analysis: Detailed Stock Forecast with Technical Indicators for Smarter Trading Decisions

This McDonald’s (MCD) Elliott Wave analysis provides a detailed stock forecast based on technical i...

Read More >

Buy 1 Month

Get 3 Months!

Special Offer:

Trade Recommendations

Unleash the power of deversified trading with our comprehensive portfolio, covering:

  • Stock Trades
  • Crypto Trades
  • Forex Trades
  • Commodity Trades
Elliott Wave Analysis

Gain a competive edge with expert insights in to:

  • Global Indices
  • US Stocks & ASX Stocks
  • Forex & Crypto
  • Commodities
Top-Notch Trading Tools

Equip yourself with the tools of success:

  • Social Chat
  • Elliott Wave Algorithm
  • Screener
  • TradingLevels
  • Trading Game
7 Elliott Wave Analysts

Stay ahead of the market with daily charts and insightful videos
-Your secret to strategic trading!

JOIN HERE


Welcome to TradingLounge (ASIC A.R.No. 321187), specialists in trades, trading education and technical analysis, covering stocks, indices, commodities, forex and cryptocurrencies.

When you join TradingLounge you have access to everything we offer, including trade tools, educational content and a social platform to chat with like-minded investors.

Read more

@Copyright 2024 by tradinglounge.com

Contact Us

Australian no: 02 4787 6020

International no: +61 (2) 47876020

Pay with:

Find us on