Gold (XAUUSD) Commodity Elliott Wave Analysis - Day Chart
Gold (XAUUSD) Commodity Daily Chart Analysis
Gold (XAUUSD) Commodity Elliott Wave Technical Analysis
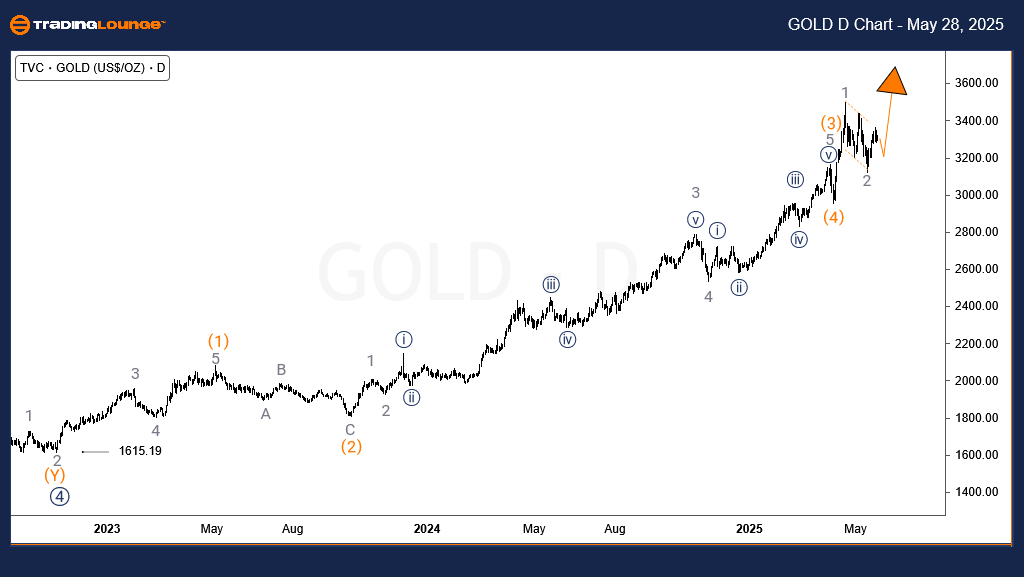
Gold's bullish trajectory initiated in October 2022, signaling the completion of primary wave ((4)) and the start of wave ((5)). At that period, Gold prices hovered around $1615. Since then, price action has completed intermediate waves (1), (2), (3), and (4), all forming part of the larger primary wave ((5)) structure. The current progression reflects wave (5) of ((5)), indicating the final leg of this long-term bullish cycle.
Based on recent movement, wave (5) is still developing. The price pullback from April 21 to May 14 aligns with wave 2 of (5). The subsequent upward trend suggests the emergence of wave 3 of (5). If buying momentum persists, Gold may break resistance and challenge the 3996 level, establishing a new high within this wave structure.
Gold (XAUUSD) Commodity Elliott Wave Analysis - 4-Hour Chart
Gold – 4-Hour Chart Analysis
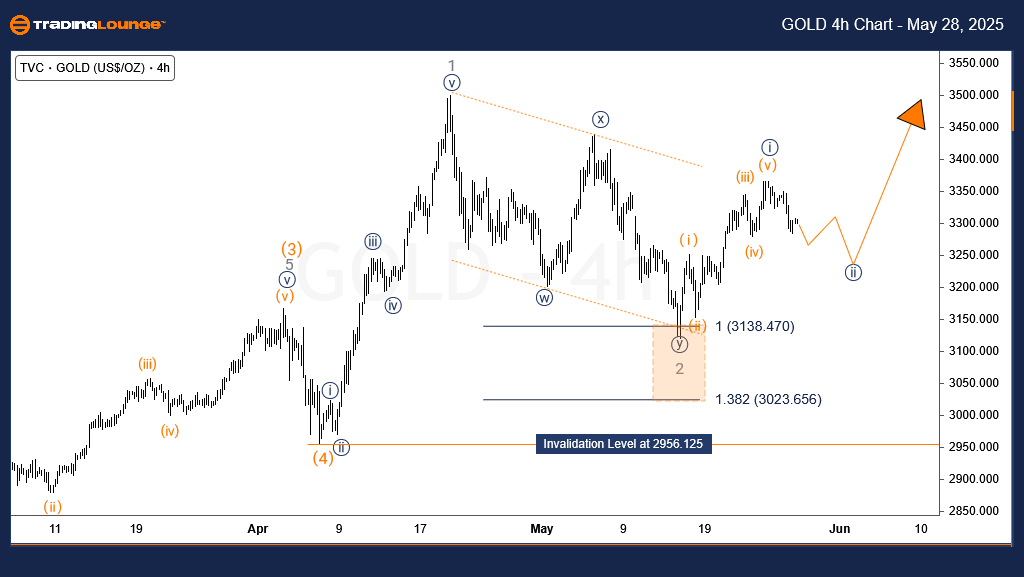
In the 4-hour timeframe, the ongoing wave 3 of (5) is unfolding. The sub-wave ((i)) appears complete, followed by a retracement in wave ((ii)). Provided that the support level at 3120.21 (wave 2’s low) remains intact, the next move — wave ((iii)) — could initiate the next significant rally phase within the current bullish impulse wave.
Technical Analyst: Sanmi Adeagbo
Source: Visit Tradinglounge.com and learn from the Experts. Join TradingLounge Here
See Previous: Corn Elliott Wave Technical Analysis
VALUE Offer - Buy 1 Month & Get 3 Months!Click here
Access 7 Analysts Over 200 Markets Covered. Chat Room With Support
Conclusion
The prevailing Elliott Wave pattern supports a bullish outlook for Gold. As long as key support levels remain firm, there's a strong possibility for prices to climb toward the 3996 target, providing multiple trading opportunities in the upward direction.