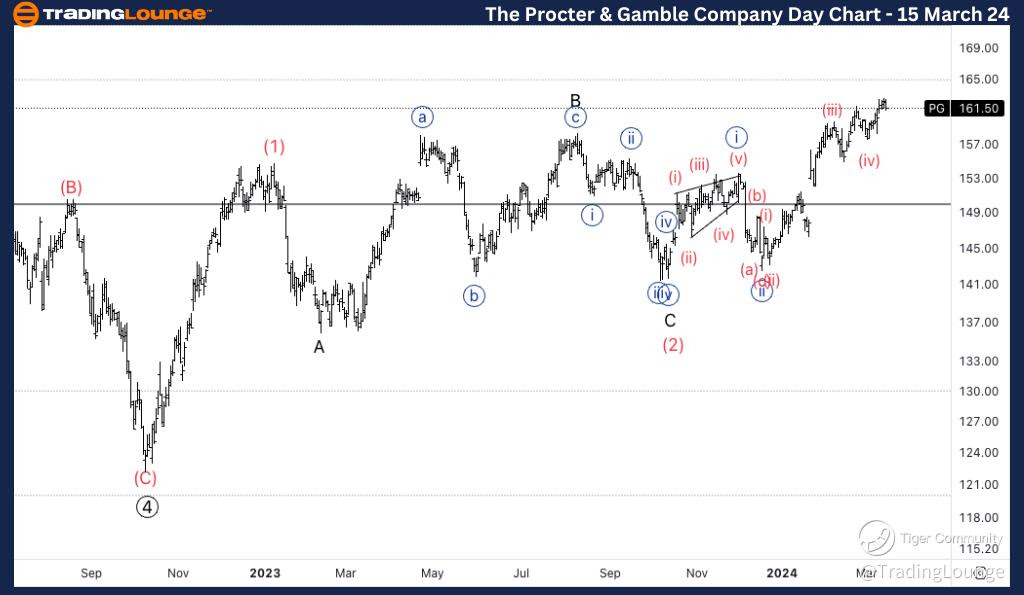
PG Elliott Wave Analysis Trading Lounge Daily Chart
In our Elliott Wave Technical Analysis, we observe a prominent trend underway for The Procter & Gamble Company (PG).
Procter & Gamble Company NYSE: PG Elliott Wave Technical Analysis
The Procter & Gamble Company (PG) Daily Chart Analysis
Function: Trend
Mode: Impulsive
Structure: Motive
Position: Wave (3)
Direction: Upside in wave 1 of (3)
PG is trading below its All-Time High (ATH) and is approaching the bottom of MG2 around $165, where resistance is anticipated.

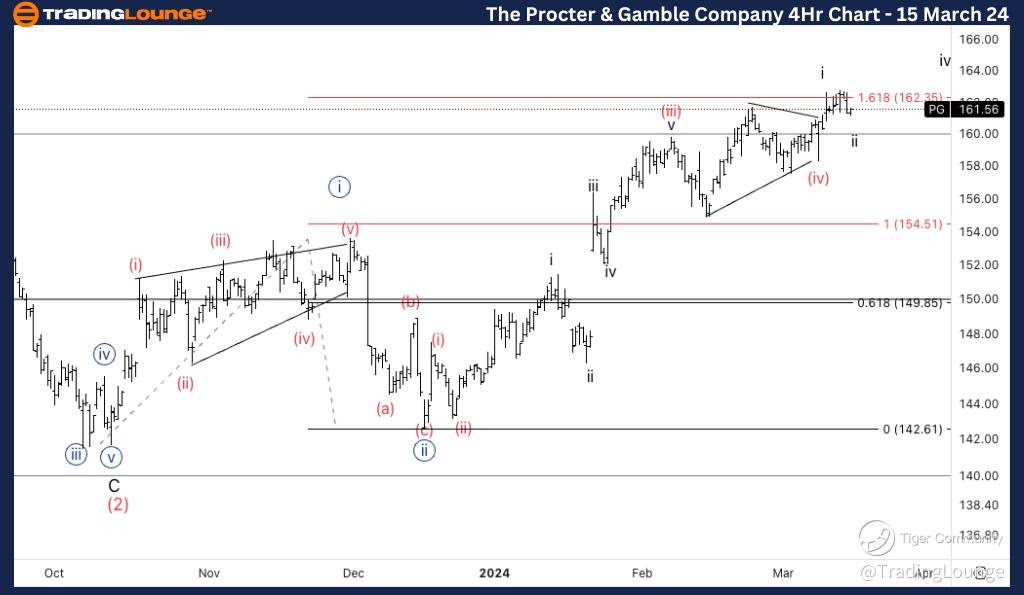
PG Elliott Wave Analysis Trading Lounge 4Hr Chart, 15 March 24
The Procter & Gamble Company (PG) 4-Hour Chart Analysis
Elliott Wave Technical Analysis of PG
Transitioning to the 4-hour chart, we maintain our Elliott Wave Technical Analysis for PG.
Function: Trend
Mode: Impulsive
Structure: Motive
Position: Wave (v) of {iii}
Direction: Upside into wave (v)
We anticipate further upside movement into wave (v) after potentially completing wave i of (v). Despite touching $162 and reaching the 161.8% Fibonacci extension level ({iii} vs. {i}), we expect $165 to serve as a resistance level.
Conclusion:
Stay informed with our comprehensive Elliott Wave analysis for The Procter & Gamble Company (PG) to guide your trading decisions. Whether you're tracking daily or 4-hour chart movements, understanding trend directions and potential resistance levels can enhance your trading strategy.
Technical Analyst: Alessio Barretta
Source: visit Tradinglounge.com and learn From the Experts Join TradingLounge Here
See Previous: The Coca-Cola Company, (KO)
TradingLounge Once Off SPECIAL DEAL: Here > 1 month Get 3 months.
