10Apr

TASI Index Elliott Wave Analysis Forecasts Bullish Trend in Saudi Stock Market with Strategic Trading Setup and Technical Insights

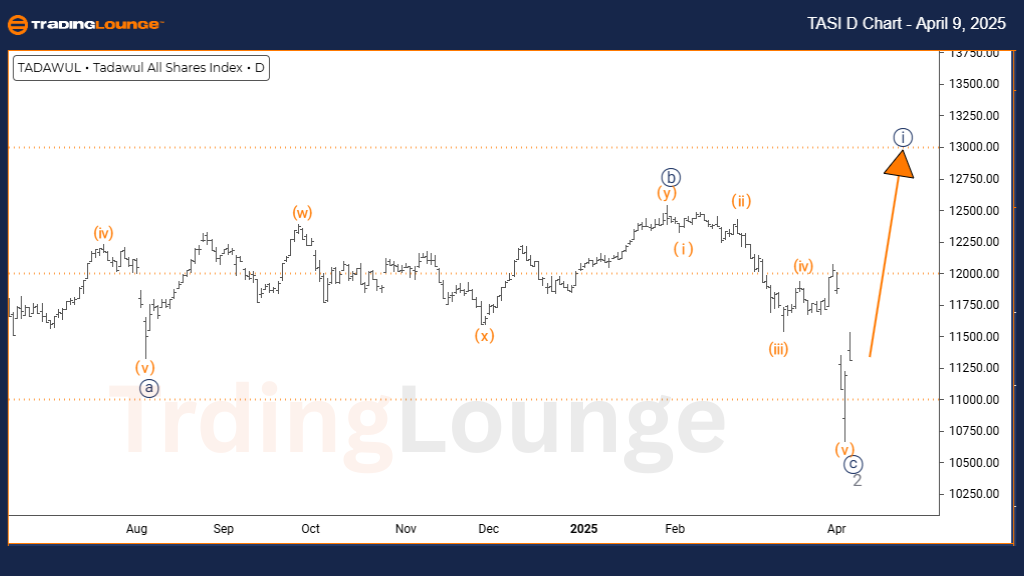
TASI INDEX Elliott Wave Analysis | TradingLounge Daily Chart

TASI INDEX Daily Chart Forecast

TASI INDEX Elliott Wave Technical Forecast

FUNCTION: Trend

MODE: Impulsive

STRUCTURE: Navy Blue Wave 1

POSITION: Gray Wave 3

DIRECTION NEXT LOWER DEGREES: Navy Blue Wave 2

DETAILS: The Completion of Gray Wave 2 is confirmed, with Navy Blue Wave 1 of 3 actively developing.

The TASI INDEX Elliott Wave Daily Analysis reveals a bullish Elliott Wave structure for the Saudi stock market index. The current impulse phase shows Navy Blue Wave 1 building within the broader Gray Wave 3, suggesting the beginning of a strong upward move. With Gray Wave 2’s correction complete, the market now enters the early stages of Navy Blue Wave 1 of 3, indicating a new bullish cycle.

This daily Elliott Wave chart helps traders identify the trend setup and strategic entry points aligned with impulsive market behavior. Once Navy Blue Wave 1 concludes, a corrective Navy Blue Wave 2 is anticipated, followed by a continuation higher into Wave 3.

Understanding wave degrees is key—Navy Blue Wave 1 not only offers a short-term trade setup but also contributes to the formation of the larger Gray Wave 3 structure. Look for early trend signals such as increasing momentum and volume.

Overall, the TASI INDEX Elliott Wave Forecast supports long-position strategies with proper risk controls, aiming to capitalize on this early bullish wave within the Saudi financial market.

TASI-INDEX-Day-Chart...


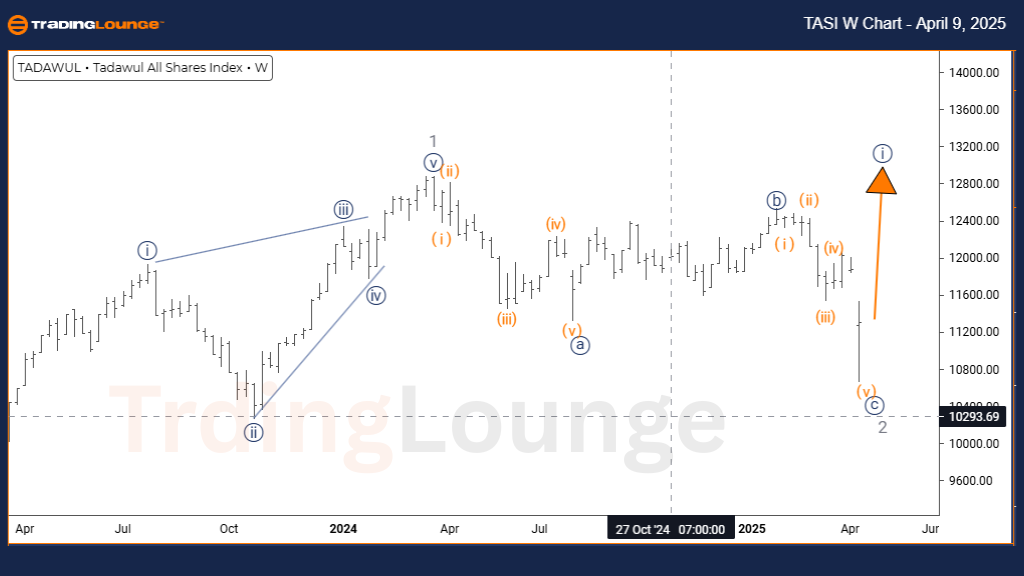
TASI INDEX Elliott Wave Analysis | TradingLounge Weekly Chart

TASI INDEX Wave Technical Forecast

FUNCTION: Trend

MODE: Impulsive

STRUCTURE: Navy Blue Wave 1

POSITION: Gray Wave 3

DIRECTION NEXT LOWER DEGREES: Navy Blue Wave 2

DETAILS: Gray Wave 2 looks complete, with Navy Blue Wave 1 of 3 now in progress.

The TASI INDEX Elliott Wave Weekly Analysis confirms a long-term bullish Elliott Wave setup for the Saudi market. The impulsive wave structure marks the beginning of Navy Blue Wave 1 within the larger Gray Wave 3 framework. With Gray Wave 2 completed, the index advances through the initial stages of Navy Blue Wave 1 of 3, suggesting a potentially robust uptrend.

The weekly timeframe offers investors a macro view of wave alignment and trend structure, highlighting the current wave’s significance within a major bullish phase. Upon the completion of Navy Blue Wave 1, a corrective Navy Blue Wave 2 is expected, preceding the next rally in Wave 3.

This Elliott Wave interpretation underlines the importance of degree clarity—Navy Blue Wave 1 reflects a medium-term trade opportunity and a key component of the larger bullish development. Key confirmation signals include rising volume and momentum, classic characteristics of a wave one impulse.

With favorable conditions emerging, this weekly Elliott Wave forecast supports long-position strategies in the TASI INDEX, appealing to swing and position traders seeking to benefit from sustained upside potential in the Saudi equity market.

Technical Analyst: Malik Awais

Source: visit Tradinglounge.com and learn From the Experts Join TradingLounge Here 

Previous: NIKKEI 225 (N225) Elliott Wave Technical Analysis

VALUE Offer - Buy 1 Month & Get 3 Months!Click here

Access 7 Analysts Over 200 Markets Covered. Chat Room With Support

TASI-INDEX-Weekly-Ch...

Related

Bovespa Index Elliott Wave Analysis: Bovespa Stock Picks, and a Technical View on Bullish and Bearish Signals in the Index Market

Bovespa Index Elliott Wave Analysis: Bovespa Stock Picks, and a Technical View on Bullish and Bearish Signals in the Index Market

This in-depth guide on Bovespa Index analysis covers essential trading insights, Elliott Wave interp...

Read More >
USDCHF Elliott Wave Technical Analysis: Price Prediction, Trading Strategy, Bearish Trend, Wave Count & Market Outlook

USDCHF Elliott Wave Technical Analysis: Price Prediction, Trading Strategy, Bearish Trend, Wave Count & Market Outlook

This USDCHF Elliott Wave Analysis provides a detailed technical breakdown of the market, highlightin...

Read More >
Elliott Wave Analysis Indices: SP 500 & NASDAQ

Elliott Wave Analysis Indices: SP 500 & NASDAQ

Elliott Wave Analysis Summary: Indices SP 500 & NASDAQ - Current wave: v of (v) of iii) of 1 o...

Read More >
Bitcoin/U.S. dollar(BTCUSD) Elliott Wave Technical Analysis 17 October 23

Bitcoin/U.S. dollar(BTCUSD) Elliott Wave Technical Analysis 17 October 23

Trading lounge Bitcoin/U.S. dollar(BTCUSD) Elliott Wave Technical Analysis 4-hour and day charts for...

Read More >
Discover Mahindra & Mahindra Stock Analysis Using Elliott Wave Techniques: Explore Price Tends and Future Predictions

Discover Mahindra & Mahindra Stock Analysis Using Elliott Wave Techniques: Explore Price Tends and Future Predictions

Mahindra & Mahindra stock is showing strong upward momentum, with Elliott Wave analysis suggesting a...

Read More >
Bitcoin/ U.S. dollar(BTCUSD) Elliott Wave Technical Analysis 11 December 23

Bitcoin/ U.S. dollar(BTCUSD) Elliott Wave Technical Analysis 11 December 23

Bitcoin/U.S. dollar(BTCUSD) Elliott Wave Technical Analysis dated 11 December 23 with Bitcoin and U....

Read More >

$1 for 2 Weeks

then $29 a month!

What a Special Offer!

Trade Recommendations

Unleash the power of deversified trading with our comprehensive portfolio, covering 250+ markets:

  • Stock Trades
  • Crypto Trades
  • Forex Trades
  • Commodity Trades
Elliott Wave Analysis

Gain a competitive edge with expert insights and AI-powered Elliott Wave charting into:

  • Global Indices
  • US Stocks & ASX Stocks
  • Forex & Crypto
  • Commodities
Top-Notch Trading Tools

Equip yourself with the tools of success:

  • Real-time Chat rooms
  • Elliott Wave Algorithm
  • Portfolio tools
  • TradingLevels
  • Screener
  • Trading Game
7 Elliott Wave Analysts

Stay ahead of the market with daily charts and insightful videos
Your secret to strategic trading!

JOIN HERE


Welcome to TradingLounge (ASIC A.R.No. 321187), specialists in trades, trading education and technical analysis, covering stocks, indices, commodities, forex and cryptocurrencies.

When you join TradingLounge you have access to everything we offer, including trade tools, educational content and a social platform to chat with like-minded investors.

Read more

@Copyright 2024 by tradinglounge.com

Contact Us

Australian no: 02 4787 6020

International no: +61 (2) 47876020

Pay with:

Find us on