12Nov

U.S. Dollar / Canadian Dollar (USDCAD) Forex Elliott Wave Technical Analysis: Unveiling Bullish Momentum and Strategic Insights

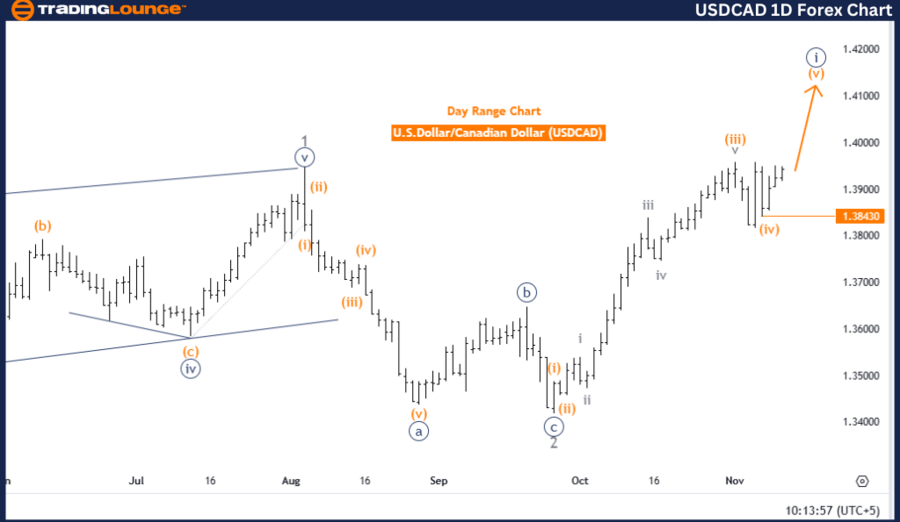
U.S. Dollar / Canadian Dollar (USDCAD) Daily Chart

USDCAD Elliott Wave Technical Analysis

Function: Trend

Mode: Impulsive

Structure: Navy blue wave 1

Position: Gray wave 3

Direction Next Lower Degrees: Navy blue wave 2

Details: Orange wave 4 of navy blue wave 1 appears completed; orange wave 5 of navy blue wave 1 is in progress.

Wave Cancel Invalidation Level: 1.38430

The USDCAD Elliott Wave analysis on the daily chart from Trading Lounge highlights an ongoing impulsive wave trend in an upward trajectory, structured as navy blue wave 1.

Key observations include:

  • Gray wave 3 remains active.
  • Orange wave 4, a sub-wave within navy blue wave 1, seems completed.
  • This completion sets the stage for orange wave 5, which is anticipated to extend the upward movement of navy blue wave 1.

The bullish trend suggests continued upward momentum as orange wave 5 progresses within this wave structure. Traders should remain attentive to wave developments and confirm the completion of orange wave 5 to validate the broader upward trajectory of navy blue wave 1.

Key Marker – Invalidation Level

The invalidation level is identified at 1.38430. A decline to or below this level would invalidate the current wave structure, signaling potential trend shifts or structural changes. This serves as a critical checkpoint for traders, offering a benchmark to validate or reassess the current analysis.

Summary

The USDCAD daily chart maintains a bullish perspective, supported by the continuation of orange wave 5 within navy blue wave 1. However, traders should stay cautious near the invalidation level of 1.38430, as a breach would necessitate a reevaluation of the wave framework.

USDCAD-1D-Forex-Char...


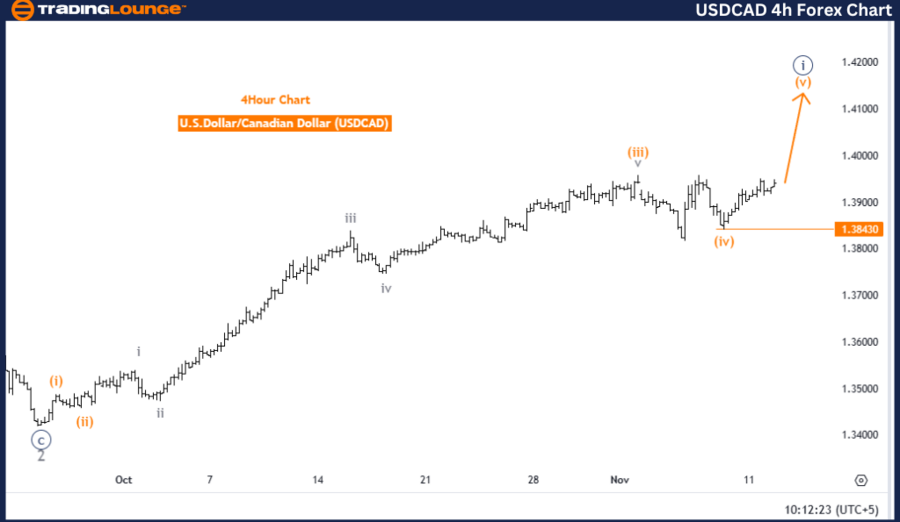
U.S. Dollar / Canadian Dollar (USDCAD) 4-Hour Chart

USDCAD Elliott Wave Technical Analysis

Function: Trend

Mode: Impulsive

Structure: Orange wave 5

Position: Navy blue wave 1

Direction Next Lower Degrees: Navy blue wave 2

Details: Orange wave 4 appears completed; orange wave 5 of navy blue wave 1 is in progress.

Wave Cancel Invalidation Level: 1.38430

The 4-hour USDCAD Elliott Wave analysis focuses on the ongoing impulsive wave structure, particularly orange wave 5, which is unfolding within the broader navy blue wave 1 framework.

Key highlights include:

  • The apparent completion of orange wave 4 has paved the way for the development of orange wave 5, which continues the upward trajectory.
  • Orange wave 5 reinforces the prevailing bullish trend within the navy blue wave 1 structure, with further upward momentum expected as this wave progresses.

Key Marker – Invalidation Level

The invalidation level is set at 1.38430. If prices fall to or below this threshold, it would disrupt the current wave structure, potentially signaling a reversal or the need for reassessment. This level acts as a pivotal reference for maintaining the integrity of the bullish trend.

Summary

The analysis on the 4-hour chart points to continued bullish momentum, with orange wave 5 leading the upward push within navy blue wave 1. Traders should monitor wave progress closely, as the completion of orange wave 5 would affirm the upward trend. However, vigilance is essential near the invalidation level of 1.38430, as any breach could indicate a breakdown of the wave framework and necessitate strategy adjustments.

Technical Analyst: Malik Awais

Source: visit Tradinglounge.com and learn From the Experts Join TradingLounge Here 

Previous: EURGBP Elliott Wave Technical Analysis 

VALUE Offer - Buy 1 Month & Get 3 Months!Click here

Access 7 Analysts Over 200 Markets Covered. Chat Room With Support

USDCAD-4h-Forex-Char...

Related

NATIONAL AUSTRALIA BANK LIMITED - NAB Stock Analysis & Elliott Wave Technical Forecast: Unlocking ASX Trading Success

NATIONAL AUSTRALIA BANK LIMITED - NAB Stock Analysis & Elliott Wave Technical Forecast: Unlocking ASX Trading Success

Elliott Wave analysis of National Australia Bank Limited (NAB) on the Australian Stock Exchange (ASX...

Read More >
USDCHF Elliott Wave Forecast Reveals Bullish Daily Trend and Corrective 4-Hour Phase with Key Invalidation Level at 0.84823

USDCHF Elliott Wave Forecast Reveals Bullish Daily Trend and Corrective 4-Hour Phase with Key Invalidation Level at 0.84823

This analysis presents a clear Elliott Wave breakdown of USDCHF using daily and 4-hour charts, highl...

Read More >
Pepsico Inc. (PEP) Elliott Wave Analysis: Unveiling Market Trends - February 13, 2024

Pepsico Inc. (PEP) Elliott Wave Analysis: Unveiling Market Trends - February 13, 2024

Explore the Elliott Wave Technical Analysis of Pepsico Inc. (PEP) on both daily and 4-hour charts as...

Read More >
Ethereum (ETHUSD) Elliott Wave Analysis Predicts $2,478 Target as Wave 3 Begins – ETH Price Forecast and Trading Strategy Included

Ethereum (ETHUSD) Elliott Wave Analysis Predicts $2,478 Target as Wave 3 Begins – ETH Price Forecast and Trading Strategy Included

Ethereum resumes its bullish trend with wave (3) in play. Elliott Wave analysis shows $2,478 as the ...

Read More >
Actionable Trading Strategies and Stock Price Forecasts for Meta Platforms Inc Using  META Stocks Elliott Wave Technical Analysis

Actionable Trading Strategies and Stock Price Forecasts for Meta Platforms Inc Using META Stocks Elliott Wave Technical Analysis

This article provides a comprehensive Elliott Wave analysis of Meta Platforms Inc. (META), offering ...

Read More >
NIKKEI 225 Index Elliott Wave Technical Analysis: Understanding the Current Corrective Phase and Future Projections

NIKKEI 225 Index Elliott Wave Technical Analysis: Understanding the Current Corrective Phase and Future Projections

This article provides a detailed Elliott Wave analysis of the NIKKEI 225, examining the current corr...

Read More >

$1 for 2 Weeks

then $29 a month!

What a Special Offer!

Trade Recommendations

Unleash the power of deversified trading with our comprehensive portfolio, covering 250+ markets:

  • Stock Trades
  • Crypto Trades
  • Forex Trades
  • Commodity Trades
Elliott Wave Analysis

Gain a competitive edge with expert insights and AI-powered Elliott Wave charting into:

  • Global Indices
  • US Stocks & ASX Stocks
  • Forex & Crypto
  • Commodities
Top-Notch Trading Tools

Equip yourself with the tools of success:

  • Real-time Chat rooms
  • Elliott Wave Algorithm
  • Portfolio tools
  • TradingLevels
  • Screener
  • Trading Game
7 Elliott Wave Analysts

Stay ahead of the market with daily charts and insightful videos
Your secret to strategic trading!

JOIN HERE


Welcome to TradingLounge (ASIC A.R.No. 321187), specialists in trades, trading education and technical analysis, covering stocks, indices, commodities, forex and cryptocurrencies.

When you join TradingLounge you have access to everything we offer, including trade tools, educational content and a social platform to chat with like-minded investors.

Read more

@Copyright 2024 by tradinglounge.com

Contact Us

Australian no: 02 4787 6020

International no: +61 (2) 47876020

Pay with:

Find us on