NEWMONT CORPORATION (ASX:NEM) Elliott Wave Forecast & Bullish Trend Outlook – Daily Chart Analysis
NEM Elliott Wave Technical Overview
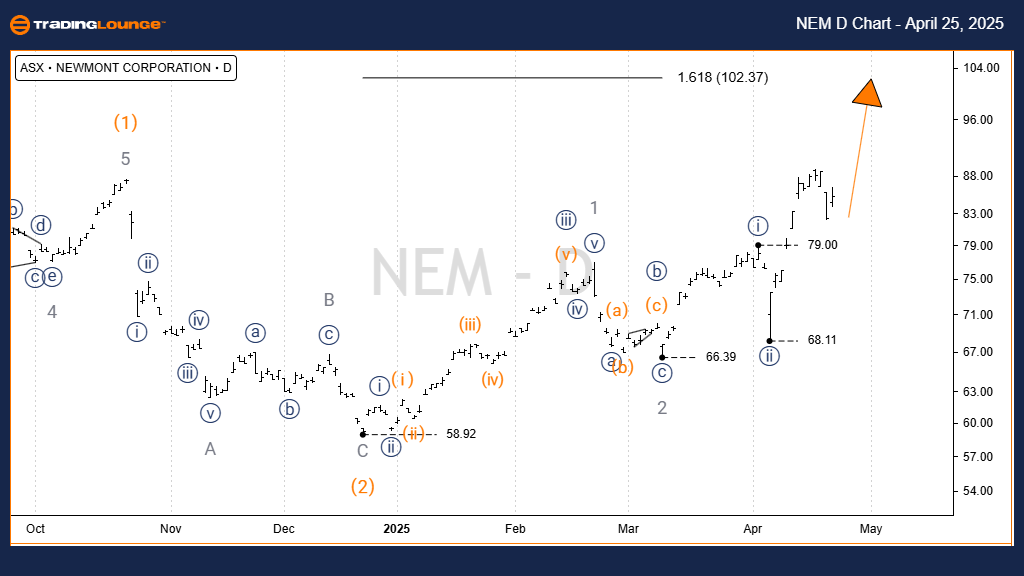
Function: Major Trend
Degree: Intermediate (orange)
Mode: Motive
Structure: Impulse
Position: Wave 3 – grey of Wave (3) – orange
Market Insight:
Our Elliott Wave forecast for Newmont Corporation (ASX:NEM) identifies a strong uptrend within wave 3. The corrective wave 2 (orange) completed near the $58.92 low. Price action now suggests that wave 3 (orange) is advancing through a clear subdivision—wave 1 (grey), wave 2 (grey), and currently wave 3 (grey) in progress. Upside targets lie near $100.00, with potential to reach $102.37 if momentum continues.
Invalidation Level: $68.11
NEWMONT CORPORATION (ASX:NEM) Short-Term Elliott Wave Structure & Price Projection – 4-Hour Chart Analysis
NEM Elliott Wave Technical Overview
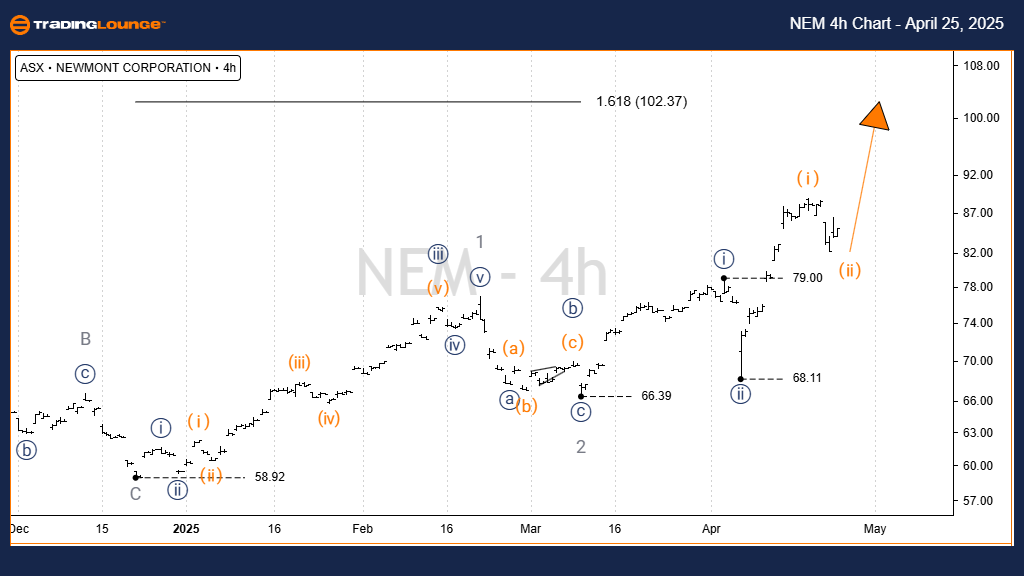
Function: Major Trend
Degree: Minor (grey)
Mode: Motive
Structure: Impulse
Position: Wave ((iii)) – navy of Wave 3 – grey
Technical Details:
Following the $58.92 low, wave 3 (orange) maintains a bullish structure. The latest price action confirms wave ((iii)) (navy) is unfolding, with price aiming toward the $102.37 resistance level. To maintain this bullish scenario, price must remain above the $68.11 invalidation level. Additionally, $79.00 serves as critical support, as a breach here by wave ((iv)) navy would disrupt the current Elliott Wave setup.
Invalidation Levels: $68.11 and $79.00
Technical Analyst: Hua (Shane) Cuong, CEWA-M (Master’s Designation).
Source: Visit Tradinglounge.com and learn from the Experts. Join TradingLounge Here
See Previous: CAR GROUP LIMITED Elliott Wave Technical Analysis
VALUE Offer - Buy 1 Month & Get 3 Months!Click here
Access 7 Analysts Over 200 Markets Covered. Chat Room With Support
Conclusion
This Elliott Wave analysis of ASX:NEM offers a precise forecast of its bullish trend, highlighting key wave positions and invalidation zones. With targets around $102.37 and support clearly defined, traders can use this structured analysis to enhance decision-making and capitalize on potential price advances. Stay aligned with the wave count to optimize your trading strategy.