13May

Natural Gas Elliott Wave Forecast Suggests Bullish Rally to $6.2 with Key Support and Resistance Levels Identified for Traders

Natural Gas Elliott Wave Forecast – Trading Lounge Insights

Natural Gas Recovery Momentum May Target $6.2

Natural Gas continues to show bullish strength after rebounding from the late April lows. This rally may be part of a larger bullish corrective cycle that began in February 2024, with potential upside aiming for the $6.2 level.


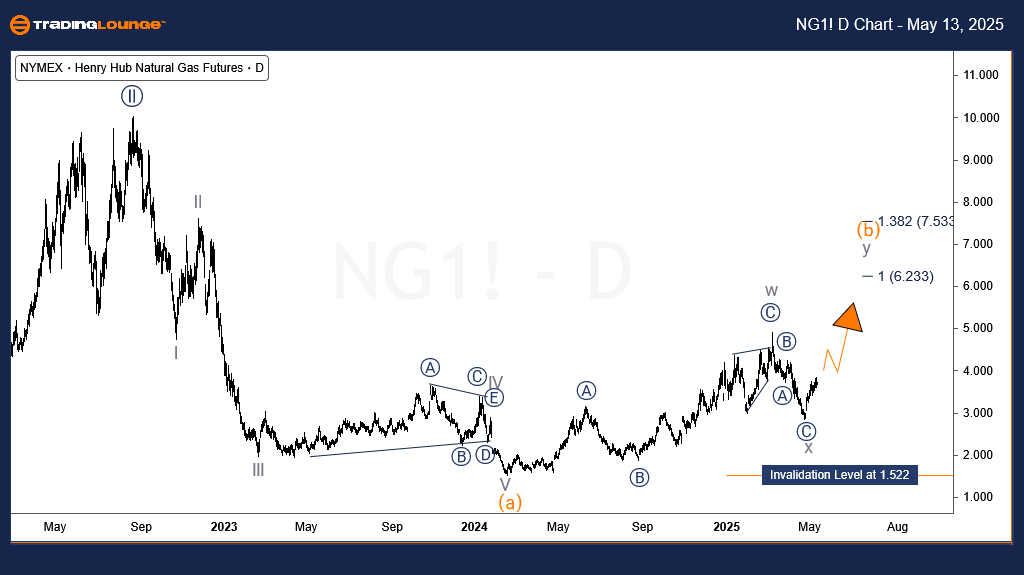
Natural Gas Elliott Wave Analysis – Daily Chart

The daily chart analysis suggests Natural Gas completed a major bearish impulse—labeled as wave (a) in Elliott Wave terminology—from the high in August 2022, bottoming in February 2024. The structure aligns with Elliott Wave principles, where a corrective 3-wave structure typically follows a completed 5-wave move.

Wave (b) appears to be forming as a double zigzag. The initial zigzag leg, wave W, ended in March 2025. It was followed by wave X, another zigzag pattern, which wrapped up by late April 2025. The current rise likely represents wave Y’s early stages. If this count proves accurate, the next targets could be $4.9 initially and potentially extend toward $6.2. The 1.522 support remains the key invalidation point for this structure.

Natural-Gas-Commodit...


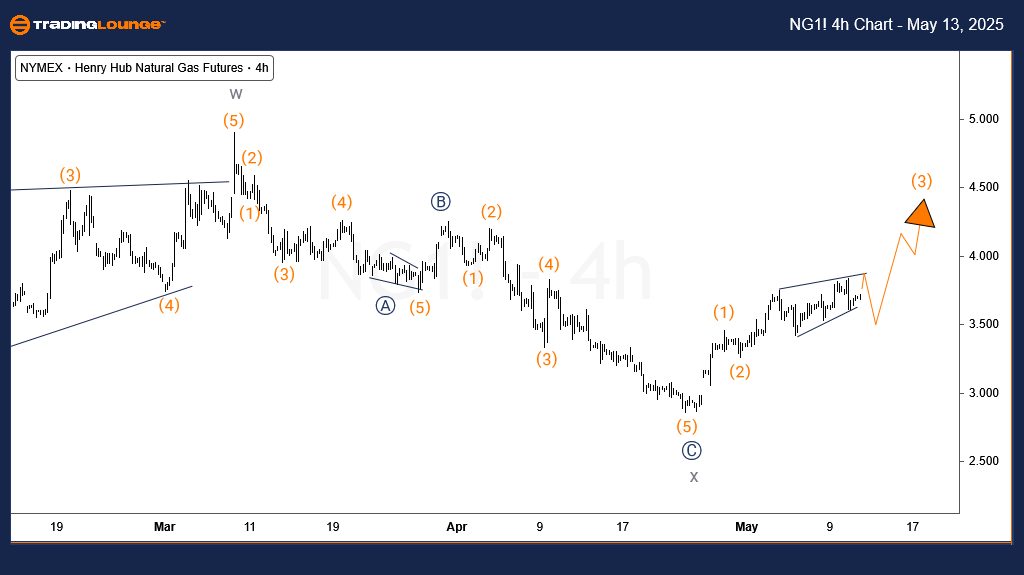
Natural Gas Elliott Wave Analysis – H4 Chart

In the H4 timeframe, the structure reveals the potential formation of wave (3) within ((1))/((A)) of wave X. This setup implies ongoing bullish momentum, with critical support found at the 2.85 level. Short-term traders should monitor the price for a full five-wave sequence from the April low. A corrective pullback following this impulse may offer a favorable entry for long positions.

Technical Analyst: Sanmi Adeagbo

Source: Visit Tradinglounge.com and learn from the Experts. Join TradingLounge Here 

See Previous: Wheat Elliott Wave Technical Analysis

VALUE Offer - Buy 1 Month & Get 3 Months!Click here

Access 7 Analysts Over 200 Markets Covered. Chat Room With Support

Natural-Gas-Commodit...

Related

XERO LIMITED's Stock Analysis & XRO Elliott Wave Technical Forecast, Price Movements In the ASX Market Outlook

XERO LIMITED's Stock Analysis & XRO Elliott Wave Technical Forecast, Price Movements In the ASX Market Outlook

Explore an in-depth Elliott Wave analysis for XERO LIMITED (ASX: XRO) with key insights into the cur...

Read More >
Ripple (XRP) Crypto Price News Today and XRPUSD Elliott Wave Technical Analysis: XRP Price Forecast and Trading Strategy

Ripple (XRP) Crypto Price News Today and XRPUSD Elliott Wave Technical Analysis: XRP Price Forecast and Trading Strategy

XRPUSD is completing a Wave 2 A-B-C correction. Watch for bullish signals around $1.90–$1.88 to ent...

Read More >
Theta Token/ U.S. dollar(THETAUSD) Elliott Wave Technical Analysis 8 December 23

Theta Token/ U.S. dollar(THETAUSD) Elliott Wave Technical Analysis 8 December 23

Theta Token/ U.S. dollar(THETAUSD) Elliott Wave Technical Analysis dated 8 December 23, Theta Token ...

Read More >
AUDUSD Elliott Wave Analysis: Impulsive Wave 1 Signals New Trend with Key Support at 0.59150 and Entry Opportunity Ahead

AUDUSD Elliott Wave Analysis: Impulsive Wave 1 Signals New Trend with Key Support at 0.59150 and Entry Opportunity Ahead

AUDUSD forms orange wave 1 in a new impulsive trend, presenting potential retracement and long-entry...

Read More >
Using Elliott Wave Theory We Forecast Potential Shifts in DE Stock: Deere & Co Stock Current Market Trends and Movements

Using Elliott Wave Theory We Forecast Potential Shifts in DE Stock: Deere & Co Stock Current Market Trends and Movements

This detailed Elliott Wave analysis of Deere & Co. (DE) highlights current market trends and price m...

Read More >
BHARAT ELECTRONICS Share Price Forecast with Elliott Wave Analysis of BEL Daily and Weekly Charts for Future Stock Prediction

BHARAT ELECTRONICS Share Price Forecast with Elliott Wave Analysis of BEL Daily and Weekly Charts for Future Stock Prediction

BHARAT ELECTRONICS using Elliott Wave Theory, covering both daily and weekly charts. It outlines the...

Read More >

$1 for 2 Weeks

then $29 a month!

What a Special Offer!

Trade Recommendations

Unleash the power of deversified trading with our comprehensive portfolio, covering 250+ markets:

  • Stock Trades
  • Crypto Trades
  • Forex Trades
  • Commodity Trades
Elliott Wave Analysis

Gain a competitive edge with expert insights and AI-powered Elliott Wave charting into:

  • Global Indices
  • US Stocks & ASX Stocks
  • Forex & Crypto
  • Commodities
Top-Notch Trading Tools

Equip yourself with the tools of success:

  • Real-time Chat rooms
  • Elliott Wave Algorithm
  • Portfolio tools
  • TradingLevels
  • Screener
  • Trading Game
7 Elliott Wave Analysts

Stay ahead of the market with daily charts and insightful videos
Your secret to strategic trading!

JOIN HERE


Welcome to TradingLounge (ASIC A.R.No. 321187), specialists in trades, trading education and technical analysis, covering stocks, indices, commodities, forex and cryptocurrencies.

When you join TradingLounge you have access to everything we offer, including trade tools, educational content and a social platform to chat with like-minded investors.

Read more

@Copyright 2024 by tradinglounge.com

Contact Us

Australian no: 02 4787 6020

International no: +61 (2) 47876020

Pay with:

Find us on