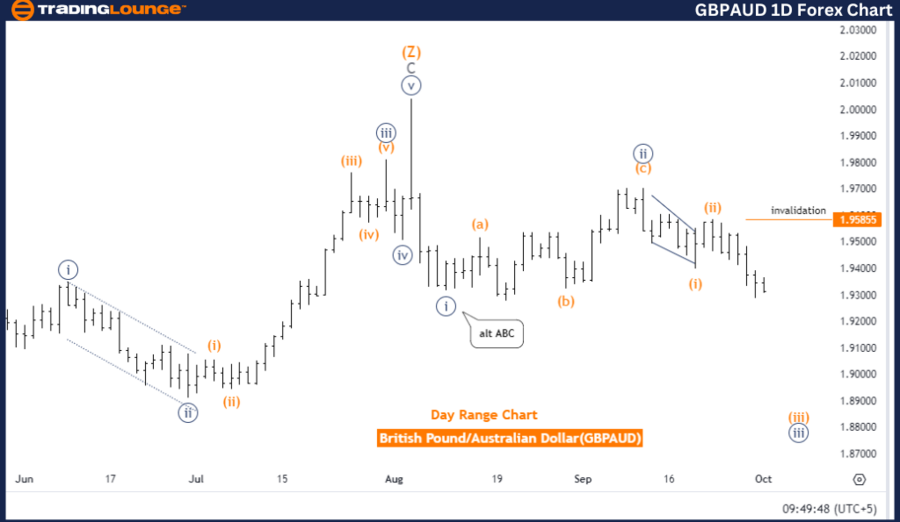
GBPAUD Elliott Wave Analysis Trading Lounge Day Chart
British Pound/Australian Dollar (GBPAUD) Day Chart
GBPAUD Elliott Wave Technical Analysis
Function: Bearish Trend
Mode: Impulsive
Structure: Orange wave 3
Position: Navy Blue Wave 3
Direction Next Lower Degrees: Orange wave 4
The GBPAUD Elliott Wave analysis for the daily chart highlights a bearish trend, signaling that the British Pound is weakening against the Australian Dollar. This trend is characterized as impulsive, indicating strong downward momentum in the market. The primary focus is on orange wave 3, a key component of the ongoing bearish movement.
Currently, the market is positioned within navy blue wave 3, which is part of the broader downtrend. Following the completion of orange wave 2, the market has now shifted into orange wave 3, maintaining its downward trajectory. In Elliott Wave Theory, wave 3 within an impulsive sequence is often the most powerful and extended, signifying that the bearish trend is intensifying as orange wave 3 progresses.
The next anticipated movement is orange wave 4, representing a corrective phase once orange wave 3 concludes. However, as of now, orange wave 3 remains active, and the market is expected to continue its downward movement before any corrective phase begins. This suggests that bearish momentum is likely to persist in the near term.
A key level to monitor is 1.95855, which serves as the wave cancel invalidation point. If the market moves above this level, the current Elliott Wave analysis would be invalidated, requiring a reassessment of the wave structure. This invalidation point is crucial for traders as it confirms whether the bearish trend remains intact.
Summary
The GBPAUD Elliott Wave analysis indicates a strong bearish trend, with orange wave 3 driving further declines. Traders should closely monitor the invalidation level of 1.95855. Any movement above this point would invalidate the current analysis and potentially shift the market outlook. Until then, the bearish trend is expected to persist unless this key level is breached.
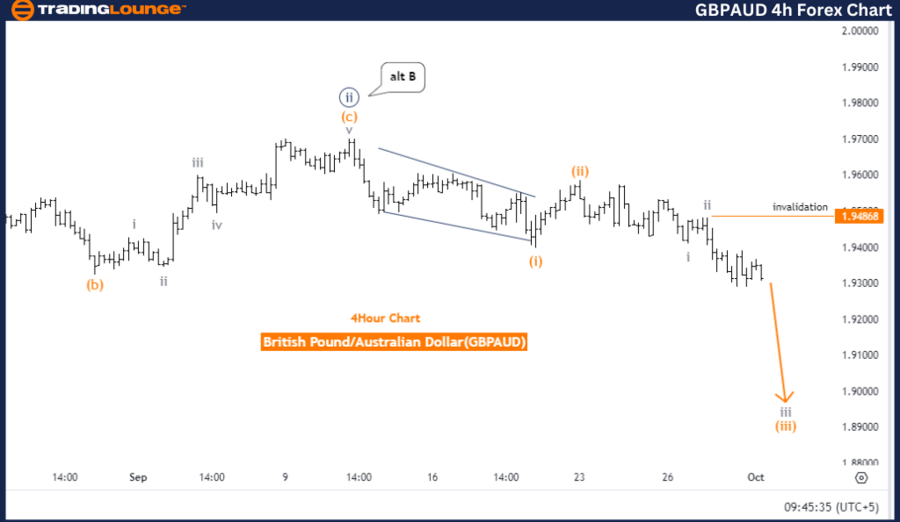
British Pound/Australian Dollar (GBPAUD) 4-Hour Chart
GBPAUD Currency Pair Technical Analysis
Function: Bearish Trend
Mode: Impulsive
Structure: Gray wave 3
Position: Orange wave 3
Direction Next Higher Degrees: Gray wave 4
The GBPAUD Elliott Wave analysis for the 4-hour chart suggests a bearish trend, indicating continued downward movement for the British Pound against the Australian Dollar. This trend is impulsive, signaling strong momentum in the direction of the trend. The primary focus is on gray wave 3, which is driving the current bearish movement.
At present, the market is positioned within orange wave 3, which forms part of the larger downward structure. After the completion of gray wave 2, the market has entered gray wave 3, signaling a continuation of the bearish trend. In Elliott Wave Theory, wave 3 within an impulsive sequence is usually the strongest, meaning the downtrend is gaining momentum as gray wave 3 progresses.
The next expected movement is gray wave 4, representing a corrective phase once wave 3 completes. However, at this point, gray wave 3 is still active, and the market is expected to continue its downward trend before any corrective movement occurs.
A critical level to watch is 1.94868, which acts as the wave cancel invalidation point. If the market moves above this level, the current Elliott Wave analysis would be invalidated, and a reassessment of the wave structure would be necessary. This level is essential for traders as it determines whether the bearish trend remains valid.
Summary
The GBPAUD Elliott Wave analysis for the 4-hour chart indicates a continued bearish trend, with gray wave 3 leading the downward movement. Traders should closely monitor the invalidation level of 1.94868, as any move above this point would invalidate the current analysis. Until then, the bearish trend is expected to persist with further downside potential.
Technical Analyst: Malik Awais
Source: visit Tradinglounge.com and learn From the Experts Join TradingLounge Here
Previous: U.S. Dollar / Canadian Dollar (USDCAD) Elliott Wave Technical Analysis
VALUE Offer - Buy 1 Month & Get 3 Months!Click here
Access 7 Analysts Over 200 Markets Covered. Chat Room With Support