Soybeans Elliott Wave Analysis

Function - Trend

Mode - Impulse

Structure - Impulse for wave (3)

Position - Wave 1 of (3)

Direction - Wave 1 of (3) is still in play

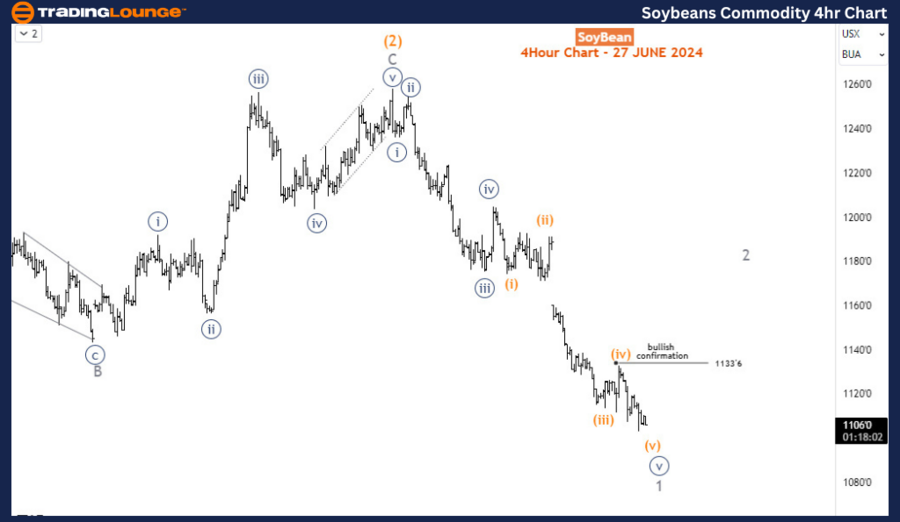
Details - Wave 1 extends lower. No signs of a bullish correction yet. Still anticipating wave 2 to begin but first confirmation is expected above 1133’6.

Soybean Elliott Wave Technical Analysis

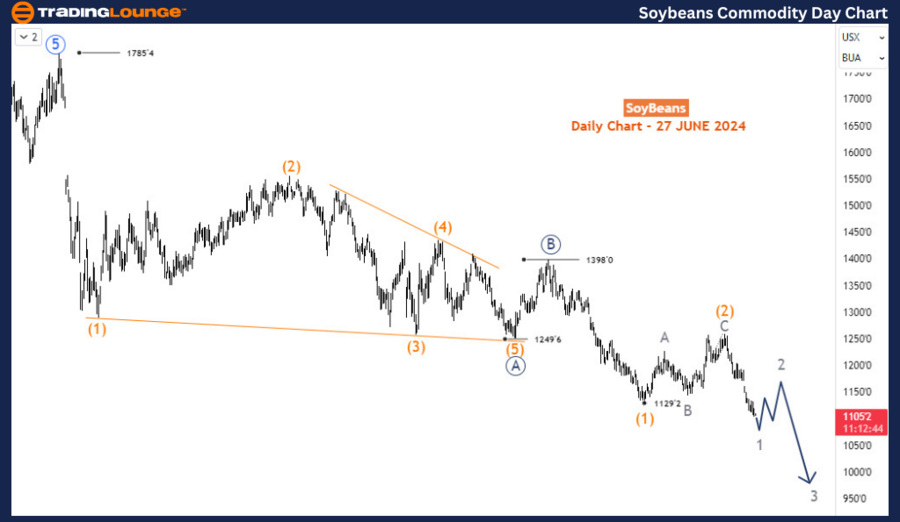
Since late May 2024, soybean prices have declined by over 12%, continuing the long-term sell-off that began in June 2022. The price has retraced completely from the recovery phase between late February and May 2024, after breaking below 1129. This breakdown suggests that soybean prices will likely continue to fall in the coming weeks. However, a rebound may occur soon to correct the current decline from May.

Daily Chart Analysis

On the daily chart, the price is following an A-B-C (circled) pattern in the primary degree. Wave A started in June 2022 at 1785 and ended with a diagonal at 1249 in October 2023. Wave B then followed, finishing at 1398 in November 2023, marking the beginning of the current wave C. Since November 2023, Wave C has been developing into an impulse wave. Wave (1) of C was completed at 1129 in late February 2024, followed by a corrective bounce for wave (2) that reached 1258 in May 2024. From the May 2024 high, wave (3) has been unfolding and could extend to the 891-829 range. Currently, the price is nearing the completion of wave 1 of (3), and a pullback for wave 2 is expected to begin soon.
Soybean-commodity-da...


H4 Chart Analysis

On the H4 chart, wave 1 is finishing an impulse wave structure, though no reversal signs are present yet. The fifth sub-wave of wave 1 is also completing an impulse, indicating that wave 1 is close to completion. A corrective bounce for wave 2 is anticipated to emerge, especially if there is a bullish reaction above 1133. After wave 2 concludes, the dominant bearish trend is expected to resume with wave 3 of (3).

Technical Analyst: Sanmi Adeagbo

Source: visit Tradinglounge.com and learn From the Experts Join TradingLounge Here 

See Previous:Silver Elliott Wave Analysis

Special Trial Offer - 0.76 Cents a Day for 3 Months! Click here

Access 7 Analysts Over 170 Markets Covered. Chat Room With Support
Soybean-commodity-4h...

Related

Elliott Wave Analysis: SP 500, NASDAQ, AAPL, AMZN, NVDA, META, NFLX, GOOGL, MSFT, TSLA, BITCOIN

Elliott Wave Analysis: SP 500, NASDAQ, AAPL, AMZN, NVDA, META, NFLX, GOOGL, MSFT, TSLA, BITCOIN

US Tech stock and indices are approaching Elliott Wave Primary 3) degree. Expect lower trading volum...

Read More >
QUALCOMM Inc. (QCOM) Stocks Elliott Wave Technical Analysis: QUALCOMM Stock Trends, Forecasts & Trading Strategies

QUALCOMM Inc. (QCOM) Stocks Elliott Wave Technical Analysis: QUALCOMM Stock Trends, Forecasts & Trading Strategies

This QCOM Elliott Wave analysis provides an in-depth look at QUALCOMM stock's corrective pattern...

Read More >
Looking to buy Bovespa stocks, invest in index funds: Bovespa Index Elliott Wave Technical Analysis

Looking to buy Bovespa stocks, invest in index funds: Bovespa Index Elliott Wave Technical Analysis

This article offers a thorough Elliott Wave analysis of the Bovespa Index, providing valuable insigh...

Read More >
British Pound/Australian Dollar (GBPAUD) Forex Elliott Wave Technical Analysis: Bearish Trend with Wave 3 Driving Further Declines

British Pound/Australian Dollar (GBPAUD) Forex Elliott Wave Technical Analysis: Bearish Trend with Wave 3 Driving Further Declines

The GBPAUD analysis on both daily and 4-hour charts shows a strong bearish trend, with navy blue wav...

Read More >
EURGBP Currency Pair: Euro/British Pound Forex Elliott Wave Technical Analysis

EURGBP Currency Pair: Euro/British Pound Forex Elliott Wave Technical Analysis

This article provides an in-depth Elliott Wave analysis of the EURGBP currency pair, highlighting ke...

Read More >
Our Technical Insights Include Detailed Chart Analysis: CSL LIMITED – CSL Stock Analysis & Elliott Wave Technical Forecast

Our Technical Insights Include Detailed Chart Analysis: CSL LIMITED – CSL Stock Analysis & Elliott Wave Technical Forecast

Explore our comprehensive Elliott Wave analysis of CSL LIMITED (ASX: CSL), focusing on the latest st...

Read More >

Buy 1 Month

Get 3 Months!

Special Offer:

Trade Recommendations

Unleash the power of deversified trading with our comprehensive portfolio, covering:

  • Stock Trades
  • Crypto Trades
  • Forex Trades
  • Commodity Trades
Elliott Wave Analysis

Gain a competive edge with expert insights in to:

  • Global Indices
  • US Stocks & ASX Stocks
  • Forex & Crypto
  • Commodities
Top-Notch Trading Tools

Equip yourself with the tools of success:

  • Social Chat
  • Elliott Wave Algorithm
  • Screener
  • TradingLevels
  • Trading Game
7 Elliott Wave Analysts

Stay ahead of the market with daily charts and insightful videos
-Your secret to strategic trading!

JOIN HERE


Welcome to TradingLounge (ASIC A.R.No. 321187), specialists in trades, trading education and technical analysis, covering stocks, indices, commodities, forex and cryptocurrencies.

When you join TradingLounge you have access to everything we offer, including trade tools, educational content and a social platform to chat with like-minded investors.

Read more

@Copyright 2024 by tradinglounge.com

Contact Us

Australian no: 02 4787 6020

International no: +61 (2) 47876020

Pay with:

Find us on