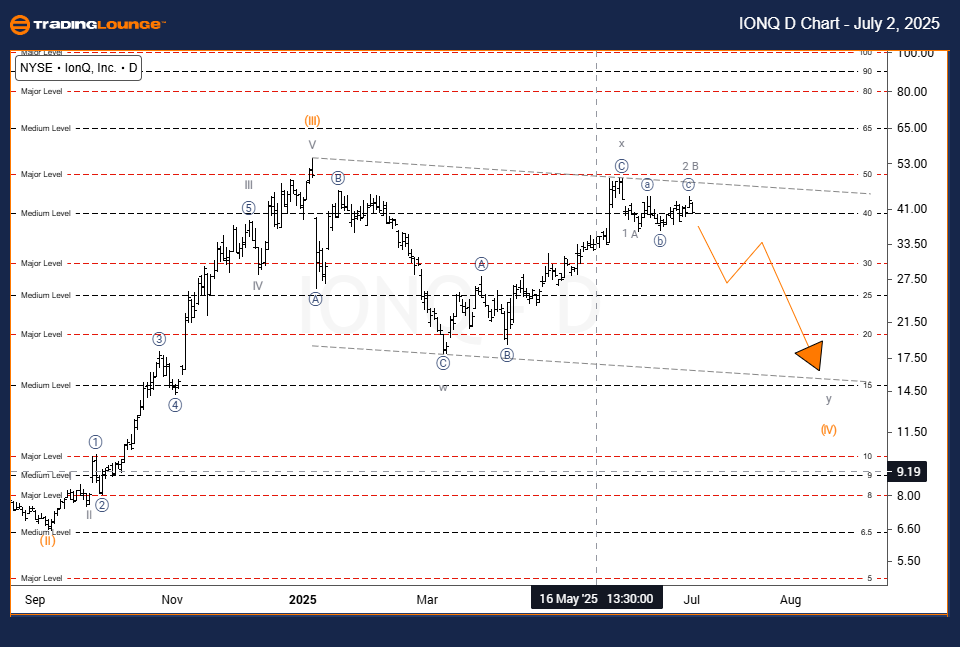
IonQ, Inc. (IONQ) Elliott Wave Analysis (Daily Chart)
IONQ Technical Chart Outlook – Trading Lounge
IONQ Elliott Wave Technical Outlook
FUNCTION: Counter Trend
MODE: Corrective
STRUCTURE: Corrective
POSITION: Wave A of y
DIRECTION: Downside in Wave C
DETAILS: Bearish move expected, targeting $25 and possibly $20 as Wave C completes
On the daily chart, IonQ stock analysis reveals the asset progressing through the final phase of a corrective Elliott Wave structure. Currently, Wave C within Wave y is actively guiding price action lower, targeting the $25 level and potentially the $20 mark. This signals a likely conclusion to the broader correction. As Wave B finalizes, further downside in Wave C is anticipated, pointing to a short-term bearish setup and potential entry points for trend-following strategies.
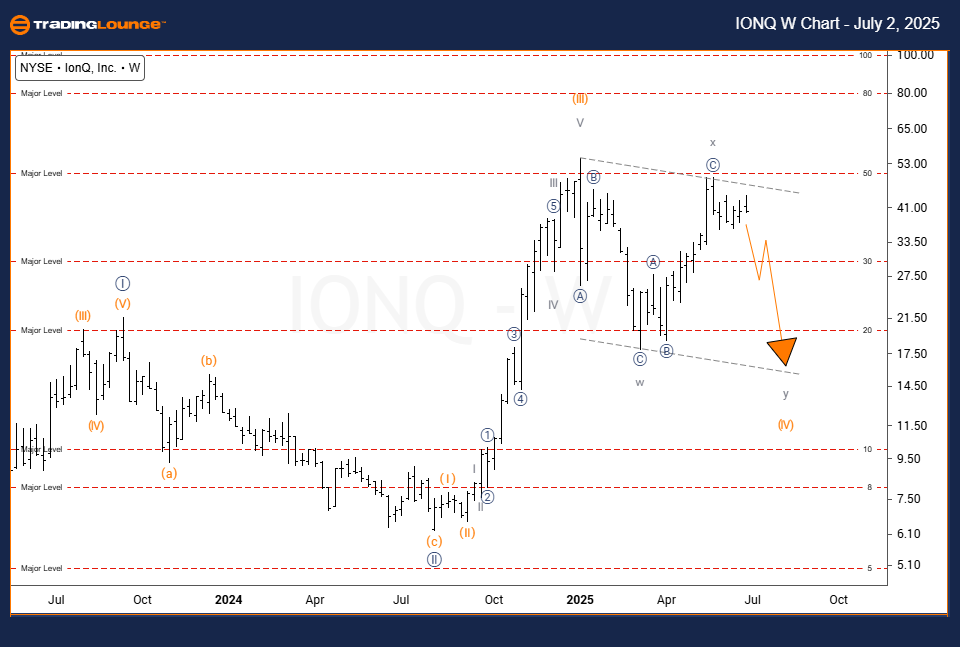
IonQ, Inc. (IONQ) – Elliott Wave Analysis (Weekly Chart)
Technical Chart Outlook – Trading Lounge
FUNCTION: Counter Trend
MODE: Corrective
STRUCTURE: Corrective
POSITION: Wave y of (IV)
DIRECTION: Downside into Wave y
DETAILS: Full 100% extension of Wave w suggests corrective maturity
On the weekly timeframe, IonQ’s technical analysis illustrates a mature corrective pattern forming as Wave y of Wave (IV) approaches completion. The price movement has matched 100% of the length of Wave w, which often indicates the end phase of a correction. Although the long-term trend remains bullish, this zone may serve as a short-term bottom, offering a potential reversal point. Traders should watch for support signals and the early signs of a new impulsive wave to the upside.
Technical Analyst: Dhiren Pahuja
Visit: TradingLounge.com for detailed analysis and market updates.
Previous: Caterpillar (CAT) Elliott Wave Technical Analysis
VALUE Offer - $1 for 2 Weeks then $29 a month!Click here
Access 7 Analysts Over 200 Markets Covered. Chat Room With Support