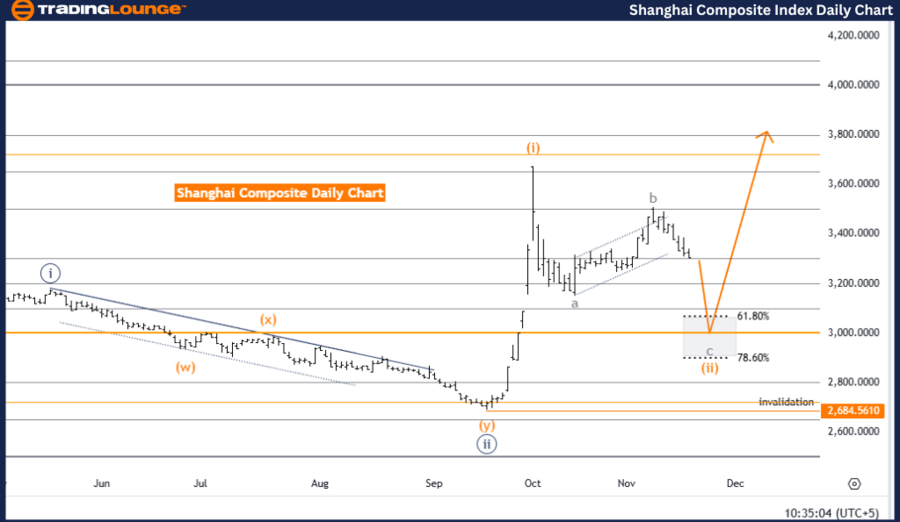
Shanghai Composite Elliott Wave Analysis | Trading Lounge (Daily Chart)
Shanghai Composite Elliott Wave Technical Analysis
Function: Counter Trend
Mode: Impulsive as C
Structure: Gray Wave C
Position: Orange Wave 2
Direction (Next Higher Degrees): Orange Wave 3
Details: Gray wave B appears completed, with gray wave C now active.
Wave Invalid Level: 2684.5610
The Shanghai Composite daily chart from Trading Lounge presents a detailed analysis of a counter-trend phase using the Elliott Wave framework. The current active wave, identified as gray wave C, resides within orange wave 2, signaling the continuation of a corrective movement. With the completion of gray wave B, the transition to gray wave C is now unfolding, highlighting the next stage of this corrective sequence.
In Elliott Wave theory, wave C within a correction often serves as the decisive phase to finalize the corrective movement. The active gray wave C aligns with this principle, representing a crucial segment within the orange wave 2 corrective structure.
An important invalidation level at 2684.5610 has been pinpointed. Should the price fall to or below this threshold, the existing wave structure would be deemed invalid, suggesting a deviation from the expected corrective path. Observing this level is critical for traders, as it confirms or refutes the anticipated wave structure and its implications for future market movements.
Summary
- The Shanghai Composite daily chart indicates a counter-trend correction driven by gray wave C, within the broader framework of orange wave 2.
- The completion of gray wave B has initiated the active phase, projecting further movement consistent with the characteristics of wave C.
- Traders must monitor the invalidation level at 2684.5610, as a breach would challenge the current structure and necessitate adjustments to the corrective outlook.

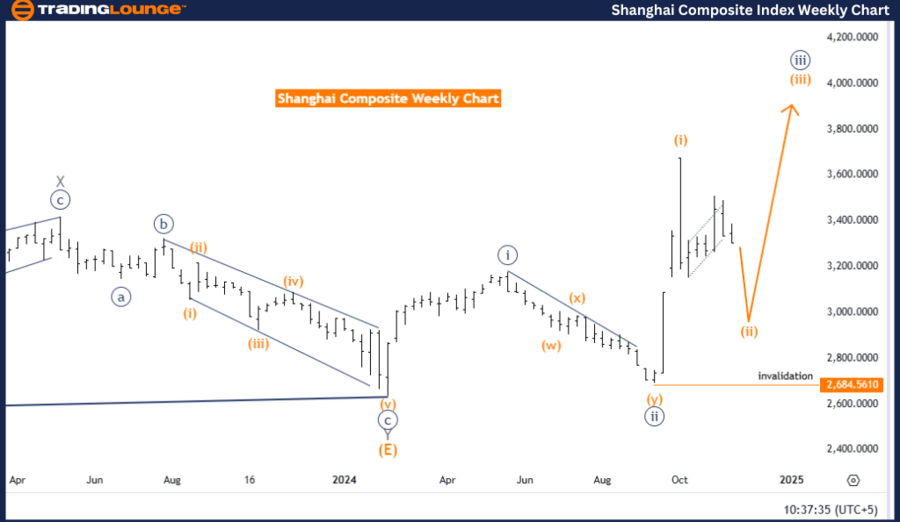
Shanghai Composite Elliott Wave Technical Analysis (Weekly Chart)
Function: Counter Trend
Mode: Corrective
Structure: Orange Wave 2
Position: Navy Blue Wave 3
Direction (Next Higher Degrees): Orange Wave 3
Details: Orange wave 1 appears completed, with orange wave 2 now active.
Wave Invalid Level: 2684.5610
The Shanghai Composite weekly chart analysis by Trading Lounge provides insight into a counter-trend corrective phase. The active wave structure is orange wave 2, situated within navy blue wave 3, marking a temporary pullback in a larger bullish trend. Following the completion of orange wave 1, the correction in orange wave 2 is now underway.
In the context of Elliott Wave theory, wave 2 generally serves as a retracement of wave 1, preceding the resumption of the trend. The ongoing orange wave 2 exemplifies this retracement phase, with potential to transition toward orange wave 3 once the correction concludes.
A critical invalidation level is identified at 2684.5610. A price drop below this level would invalidate the current wave structure, signaling a shift from the expected corrective movement. For traders, monitoring this key level is essential to validate the integrity of the wave structure and anticipate broader market trends.
Summary
- The Shanghai Composite weekly chart showcases a counter-trend corrective phase, led by orange wave 2 within navy blue wave 3.
- The completion of orange wave 1 has triggered the pullback phase consistent with wave 2 characteristics.
- Traders should track the invalidation level at 2684.5610, as a breach would require reassessment of the wave structure and market outlook.
Technical Analyst: Malik Awais
Source: visit Tradinglounge.com and learn From the Experts Join TradingLounge Here
Previous: DOW JONES - DJI Elliott Wave Technical Analysis
VALUE Offer - Buy 1 Month & Get 3 Months!Click here
Access 7 Analysts Over 200 Markets Covered. Chat Room With Support
