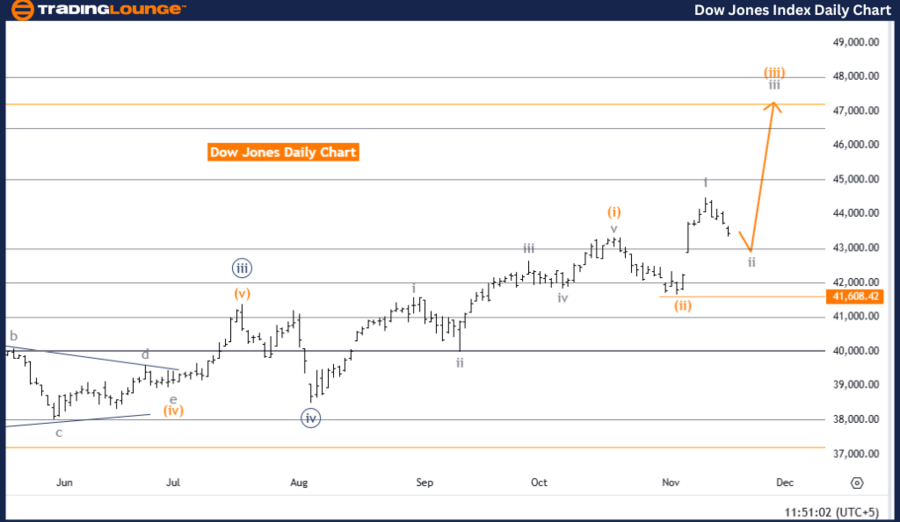
DOW JONES - DJI Elliott Wave Analysis Trading Lounge Daily Chart
DOW JONES - DJI Elliott Wave Technical Analysis
Key Details:
Function: Counter Trend
Mode: Corrective
Structure: Gray wave 2
Position: Orange wave 3
Direction Next Higher Degrees: Gray wave 3
Details: Gray wave 1 appears complete; gray wave 2 is now active.
Wave Cancel Invalidation Level: 41,608.42
Detailed Analysis:
The DOW JONES daily chart highlights a counter-trend corrective phase in the Elliott Wave sequence. The active wave, gray wave 2, is progressing within a broader framework aiming toward gray wave 3. The earlier completion of gray wave 1 sets the stage for gray wave 2, representing a temporary pullback before the main upward trend resumes.
Corrective waves like gray wave 2 typically retrace a portion of the prior impulsive wave, allowing the market to consolidate before advancing. This phase is often marked by market fluctuations, providing opportunities for stabilization or minor corrections. The subsequent advance toward gray wave 3 would signal the continuation of the primary upward trend.
Key Level for Validation:
The critical invalidation level is set at 41,608.42. If the price exceeds this level, the current wave structure would be invalidated, suggesting a potential shift in market dynamics. Monitoring this threshold is crucial for traders to confirm the ongoing corrective phase or reassess the wave count if the level is breached.
Summary:
The daily chart analysis underscores a counter-trend corrective phase, with gray wave 2 developing after the completion of gray wave 1. This phase is anticipated to precede the upward movement of gray wave 3. Traders should pay close attention to the invalidation level at 41,608.42, as any price movement above this point could challenge the current wave structure and require a reevaluation of the Elliott Wave analysis.
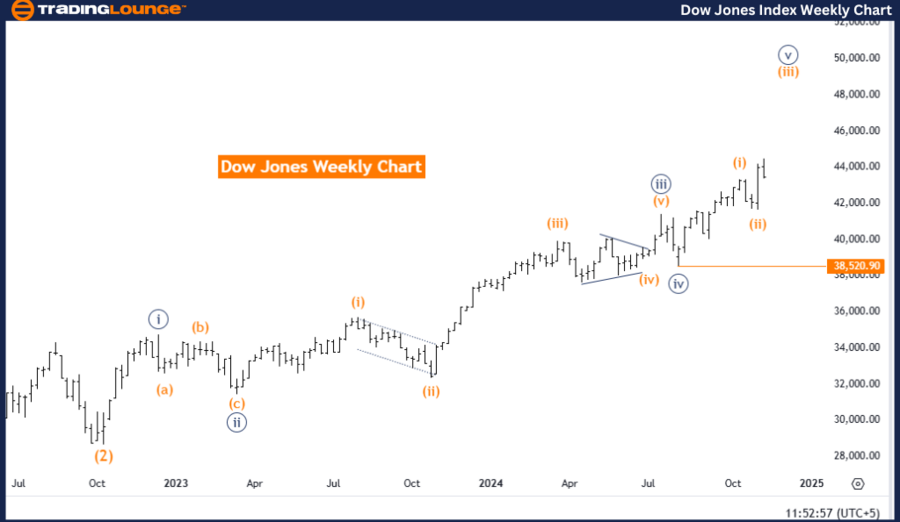
DOW JONES - DJI Elliott Wave Analysis Trading Lounge Weekly Chart
DOW JONES - DJI Elliott Wave Technical Analysis
Key Details:
Function: Bullish Trend
Mode: Impulsive
Structure: Orange wave 3
Position: Navy blue wave 5
Direction Next Lower Degrees: Orange wave 4
Details: Orange wave 2 appears complete; orange wave 3 is now active.
Wave Cancel Invalidation Level: 38,520.90
Detailed Analysis:
The DOW JONES weekly chart confirms a bullish trend, supported by an impulsive Elliott Wave structure. The current wave, orange wave 3, is advancing within navy blue wave 5, signaling strong upward momentum. With orange wave 2 completed, the focus shifts to the powerful upward trajectory of orange wave 3, a hallmark of Elliott Wave patterns.
According to the theory, wave 3 is often the most dynamic and extended wave in an impulsive sequence. Its development within navy blue wave 5 suggests sustained upward movement and market strength, with more gains expected before transitioning into the corrective phase of orange wave 4.
Key Level for Validation:
The critical invalidation level is defined at 38,520.90. A decline to or below this level would invalidate the current wave structure, indicating a potential trend reversal or weakening. This threshold is vital for traders to confirm the accuracy of the wave pattern and adjust their market strategy accordingly.
Summary:
The weekly chart analysis indicates a bullish trend, driven by the upward progression of orange wave 3 within navy blue wave 5. Following the completion of orange wave 2, the market is positioned for continued growth before entering the corrective phase of orange wave 4. Traders should monitor the invalidation level at 38,520.90 closely, as a breach of this point would challenge the current bullish outlook and require a reassessment of the Elliott Wave structure.
Technical Analyst: Malik Awais
Source: visit Tradinglounge.com and learn From the Experts Join TradingLounge Here
Previous: S&P/TSX 60 index Elliott Wave Technical Analysis
VALUE Offer - Buy 1 Month & Get 3 Months!Click here
Access 7 Analysts Over 200 Markets Covered. Chat Room With Support