15Nov

Buying TSX Composite Stocks or Analyzing ETFs This Guide Provides Essential Updates: S&P/TSX 60 Index Elliott Wave Technical Analysis

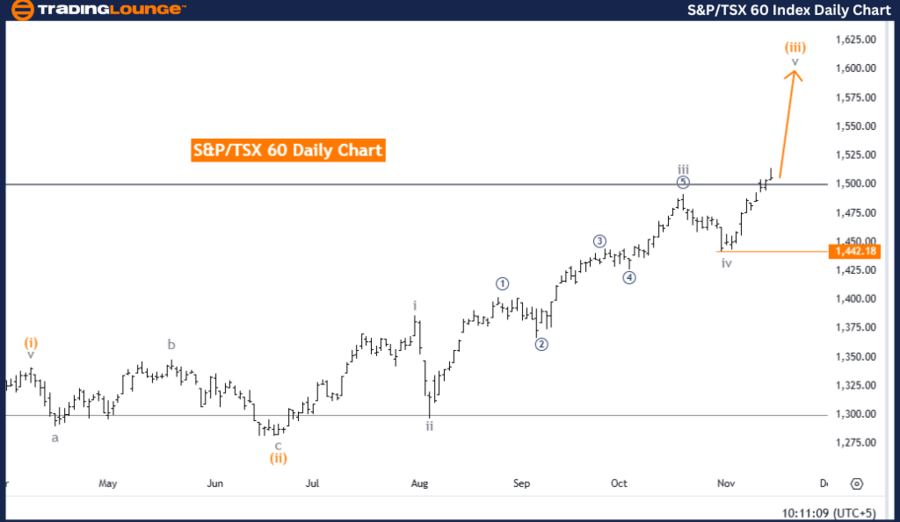
S&P/TSX 60 Elliott Wave Analysis - Trading Lounge Daily Chart

S&P/TSX 60 Elliott Wave Technical Analysis

Function: Trend

Mode: Impulsive

Structure: Gray Wave 5

Position: Orange Wave 3

Direction (Next Lower Degrees): Orange Wave 4

Details

The S&P/TSX 60 daily chart analysis from Trading Lounge showcases a consistent upward trend within the Canadian stock index. The ongoing structure exhibits an impulsive Elliott Wave pattern, with Gray Wave 5 actively progressing as part of Orange Wave 3. This formation suggests a continuation of bullish momentum in the market.

  • Gray Wave 4 of Orange Wave 3 has completed, paving the way for Gray Wave 5 to extend further gains.

S&P/TSX Elliott Wave Theory Insights

  • Wave 5 within an impulsive structure typically indicates the final upward thrust of a trend, generally preceding a corrective phase.

  • In the context of Orange Wave 3, Gray Wave 5 complements the prevailing bullish momentum and is expected to lead the index higher before the anticipated Orange Wave 4 correction begins.

Key Level for Wave Invalidation

  • Critical Level: 1,442.18
    If the index falls to or below 1,442.18, the current wave count becomes invalid. Such a move would signify a weakening in bullish momentum and could mark a potential trend reversal.

This invalidation point is crucial for traders as it serves as a checkpoint for market strength. A breach of this level would necessitate a reanalysis of the Elliott Wave structure and potentially a strategic pivot.

Summary and Market Outlook

  • The S&P/TSX 60 Elliott Wave analysis indicates a bullish trend, with Gray Wave 5 advancing within Orange Wave 3.

  • Additional upward movement is anticipated as Gray Wave 5 continues to develop.
  • Traders should closely monitor the invalidation level at 1,442.18, as a breach may disrupt the bullish structure, signaling a potential reversal or pause in upward momentum.

This level remains a critical marker for evaluating the strength and sustainability of the bullish trend in the S&P/TSX 60 index.

S&P-TSX-60-Index-Dai...


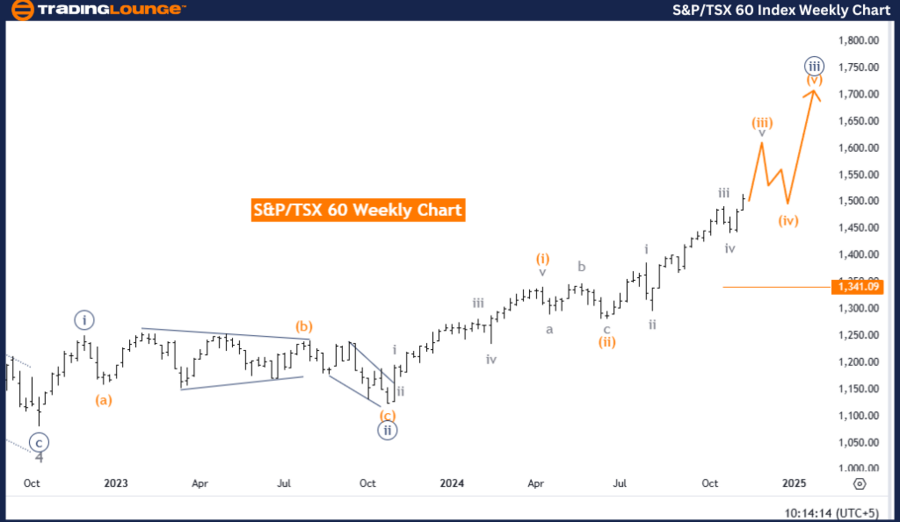
S&P/TSX 60 Elliott Wave Analysis - Trading Lounge Weekly Chart

S&P/TSX 60 Elliott Wave Technical Analysis

Function: Trend

Mode: Impulsive

Structure: Navy Blue Wave 3

Position: Gray Wave 5

Direction (Next Lower Degrees): Navy Blue Wave 4

Details

The S&P/TSX 60 weekly chart analysis by Trading Lounge reflects a persistent upward trend in the Canadian stock index. This movement aligns with an impulsive Elliott Wave structure, where Navy Blue Wave 3 is currently active. Within this broader wave, Gray Wave 5 is progressing, reinforcing the bullish outlook.

Following the conclusion of Navy Blue Wave 2, the emergence of Navy Blue Wave 3 signifies a dominant upward trend. This wave structure indicates potential for further gains as the bullish momentum continues.

S&P/TSX 60 Elliott Wave Theory Insights

  • Wave 3 in an impulsive structure is often the most robust phase, marked by significant upward momentum.

  • Gray Wave 5, within Navy Blue Wave 3, sustains this bullish perspective, hinting at additional gains before the expected Navy Blue Wave 4 correction.

Key Level for Wave Invalidation

  • Critical Level: 1,341.09
    A decline to or below 1,341.09 invalidates the current wave count, potentially signaling a weakening trend or a reversal in market direction.

This level is vital for traders to assess market momentum and strength. A breach could prompt a re-evaluation of the Elliott Wave sequence, indicating possible changes in market dynamics.

Summary and Market Outlook

  • The S&P/TSX 60 Elliott Wave weekly chart analysis maintains a bullish projection, driven by Navy Blue Wave 3 with Gray Wave 5 in progress.

  • Medium-term forecasts suggest continued upward movement, supported by the current impulsive wave structure.
  • Traders are advised to monitor the invalidation level at 1,341.09, as a breach may disrupt the bullish framework and hint at a market reversal.

This critical level serves as a reference for validating the ongoing strength and persistence of the bullish trend in the S&P/TSX 60 index.

Technical Analyst: Malik Awais

Source: visit Tradinglounge.com and learn From the Experts Join TradingLounge Here 

Previous: IBEX 35 Elliott Wave Technical Analysis

VALUE Offer - Buy 1 Month & Get 3 Months!Click here

Access 7 Analysts Over 200 Markets Covered. Chat Room With Support

S&P-TSX-60-Index-Wee...

Related

Euro/British Pound EURGBP Forex Elliott Wave Technical Analysis: In-Depth Insights for Daily and 4-Hour Charts

Euro/British Pound EURGBP Forex Elliott Wave Technical Analysis: In-Depth Insights for Daily and 4-Hour Charts

Our EURGBP Elliott Wave Analysis provides a thorough examination of the Euro against the British Pou...

Read More >
 Forex USD/JPY Currency Pair and U.S. Dollar/Japanese Yen (USDJPY) Forex Elliott Wave Technical Analysis

Forex USD/JPY Currency Pair and U.S. Dollar/Japanese Yen (USDJPY) Forex Elliott Wave Technical Analysis

Gain in-depth USD/JPY Elliott Wave analysis knowledge with our comprehensive guide. Learn about curr...

Read More >
Understand Forex Market Trends, Wave Structures, and Forecasted Movements: AUDJPY Forex Elliott Wave Technical Analysis

Understand Forex Market Trends, Wave Structures, and Forecasted Movements: AUDJPY Forex Elliott Wave Technical Analysis

Our detailed AUDJPY Elliott Wave Analysis covers both daily and 4-hour charts, providing a comprehen...

Read More >
Polkadot/U.S. dollar(DOTUSD) Elliott Wave Technical Analysis 19 October 23

Polkadot/U.S. dollar(DOTUSD) Elliott Wave Technical Analysis 19 October 23

DOTUSD Elliott Wave Analysis TradingLounge Daily and 4-hour Chart for 19 October 23.

Read More >
MicroStrategy Inc. (MSTR) Stocks Elliott Wave Technical Analysis: Covers Potential Trends, Trading Strategies, and Key Resistance Levels

MicroStrategy Inc. (MSTR) Stocks Elliott Wave Technical Analysis: Covers Potential Trends, Trading Strategies, and Key Resistance Levels

Discover the latest MicroStrategy (MSTR) stock analysis, including Elliott Wave forecasts, price pre...

Read More >
Australian Dollar / Japanese Yen(AUDJPY) Elliott Wave Technical Analysis 4 December 23

Australian Dollar / Japanese Yen(AUDJPY) Elliott Wave Technical Analysis 4 December 23

Australian Dollar / Japanese Yen(AUDJPY) Elliott Wave Technical Analysis 4 December 23, focuses on t...

Read More >

Buy 1 Month

Get 3 Months!

Special Offer:

Trade Recommendations

Unleash the power of deversified trading with our comprehensive portfolio, covering:

  • Stock Trades
  • Crypto Trades
  • Forex Trades
  • Commodity Trades
Elliott Wave Analysis

Gain a competive edge with expert insights in to:

  • Global Indices
  • US Stocks & ASX Stocks
  • Forex & Crypto
  • Commodities
Top-Notch Trading Tools

Equip yourself with the tools of success:

  • Social Chat
  • Elliott Wave Algorithm
  • Screener
  • TradingLevels
  • Trading Game
7 Elliott Wave Analysts

Stay ahead of the market with daily charts and insightful videos
-Your secret to strategic trading!

JOIN HERE


Welcome to TradingLounge (ASIC A.R.No. 321187), specialists in trades, trading education and technical analysis, covering stocks, indices, commodities, forex and cryptocurrencies.

When you join TradingLounge you have access to everything we offer, including trade tools, educational content and a social platform to chat with like-minded investors.

Read more

@Copyright 2024 by tradinglounge.com

Contact Us

Australian no: 02 4787 6020

International no: +61 (2) 47876020

Pay with:

Find us on