EURGBP Elliott Wave Analysis Trading Lounge Day Chart
Euro/British Pound (EURGBP) Day Chart Analysis
EURGBP Elliott Wave Technical Analysis
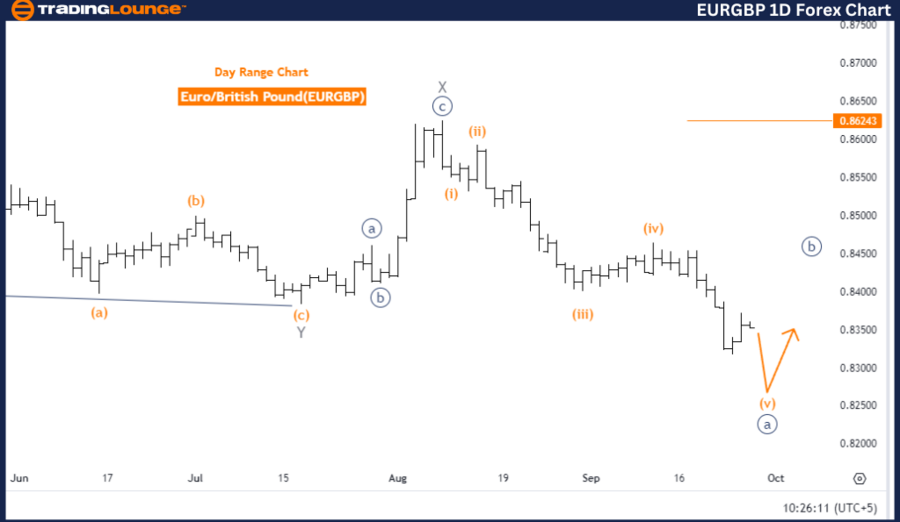
Function: Counter Trend
Mode: Impulsive
Structure: Orange Wave 5
Position: Navy Blue Wave A
Direction Next Higher Degrees: Navy Blue Wave B
Details: Orange Wave 4 appears completed, with Orange Wave 5 in progress.
Wave Cancel Invalid Level: 0.86243
The EURGBP Day Chart, analyzed using Elliott Wave theory, reveals a counter-trend structure. The chart presents an impulsive mode where Orange Wave 5 is unfolding. Following the completion of Orange Wave 4, the current focus is on the active progression of Orange Wave 5, suggesting the continuation of the ongoing impulsive trend.
The market is currently in Navy Blue Wave A, which is part of a larger wave cycle. The next anticipated movement at a higher degree is Navy Blue Wave B, signaling that after Orange Wave 5 and Navy Blue Wave A complete, the market could enter a corrective phase corresponding to Navy Blue Wave B. This phase would indicate a temporary reversal in the current counter-trend structure.
A crucial point in this analysis is the invalidation level at 0.86243. If the price exceeds this level, the existing wave structure would become invalid, potentially indicating a trend shift or requiring a reassessment of the wave count. However, as long as the price remains below this threshold, the current counter-trend structure holds, with further progression of Orange Wave 5 expected.
Summary
The EURGBP Day Chart illustrates the completion of Orange Wave 4 and the ongoing development of Orange Wave 5, indicating a broader counter-trend movement. The market is currently in Navy Blue Wave A, and once this impulsive wave concludes, a corrective phase (Navy Blue Wave B) could follow. The invalidation level of 0.86243 is critical in determining whether the current wave structure remains valid.
EURGBP Elliott Wave Analysis Trading Lounge 4H Chart
Euro/British Pound (EURGBP) 4-Hour Chart
EURGBP Elliott Wave Technical Analysis
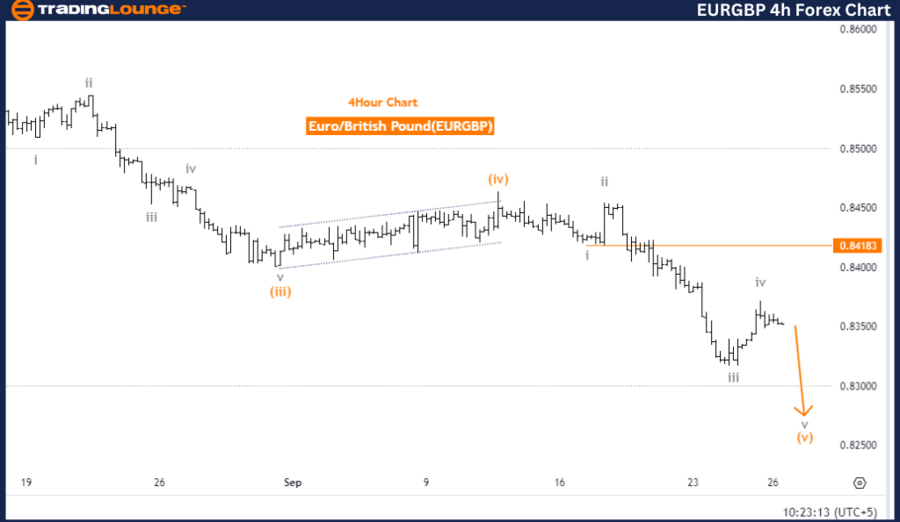
Function: Bearish Trend
Mode: Impulsive
Structure: Gray Wave 5
Position: Orange Wave 5
Details: Gray Wave 4 appears completed, with Gray Wave 5 now in progress.
Wave Cancel Invalid Level: 0.84183
The EURGBP 4-hour chart shows a bearish trend based on Elliott Wave analysis. The chart displays an impulsive mode, with Gray Wave 5 unfolding. This suggests that Gray Wave 4, the previous corrective phase, has completed, and the price is now advancing through Gray Wave 5, which is the final stage of the wave cycle.
As Gray Wave 5 progresses, a continuation of the bearish trend is expected, following the completion of Gray Wave 4. This supports the ongoing impulsive bearish structure, implying that the market is nearing the end of the current wave cycle.
Traders tracking Orange Wave 5 should remain alert to potential further declines as this wave develops within the larger structure of Gray Wave 5.
A key component of this analysis is the invalidation level at 0.84183. If the price surpasses this threshold, the current bearish wave structure would be invalid, suggesting a potential trend reversal or requiring a reassessment of the wave count. However, provided the price stays below this level, the bearish impulsive wave remains in effect, and further downside movement is anticipated.
Conclusion
The EURGBP 4-hour chart highlights the completion of Gray Wave 4 and the ongoing development of Gray Wave 5, signaling a bearish trend. Traders should closely monitor the invalidation level of 0.84183, as exceeding this level would invalidate the current wave structure. The expectation is for continued bearish movement as Orange Wave 5 progresses within Gray Wave 5.
Technical Analyst: Malik Awais
Source: visit Tradinglounge.com and learn From the Experts Join TradingLounge Here
Previous: Euro/ U.S. Dollar (EURUSD) Elliott Wave Technical Analysis
VALUE Offer - Buy 1 Month & Get 3 Months!Click here
Access 7 Analysts Over 200 Markets Covered. Chat Room With Support