12Jul

Spotify Technology S.A. (SPOT) Elliott Wave Technical Analysis: Chart Trends, Identifies Key Support levels, and Provides Insights

Welcome to our latest Elliott Wave analysis for Spotify Technology S.A. (SPOT) as of July 12, 2024. This analysis provides an in-depth look at SPOT's price movements using the Elliott Wave Theory, helping traders identify potential opportunities based on current trends and market structure. We will cover insights from both the daily and 4-hour charts to offer a comprehensive perspective on SPOT's market behavior.

SPOT Elliott Wave Analysis Trading Lounge Daily Chart

Spotify Technology S.A. (SPOT) Daily Chart

SPOT Elliott Wave Technical Analysis

Function: Counter Trend

Mode: Corrective

Structure: Flat

Position: Wave 4

Direction: Bottom in wave 4

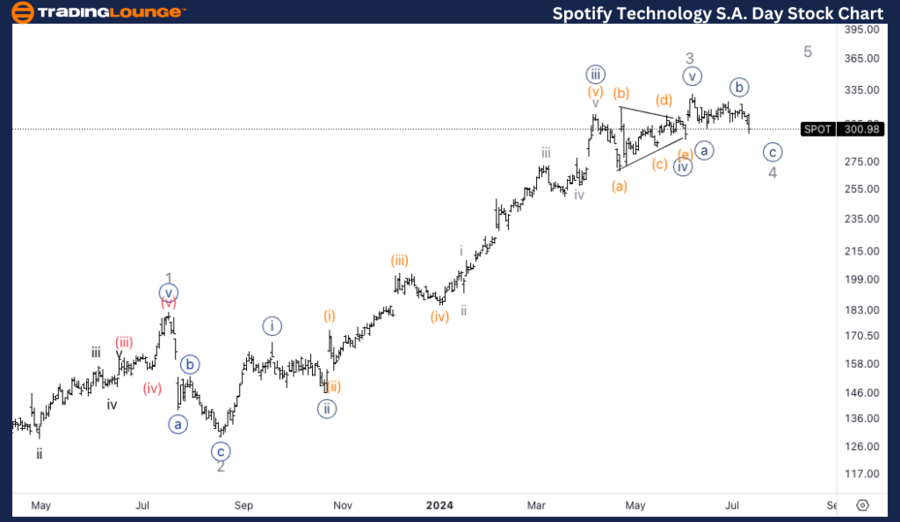
Details: Looking for developments in Minor wave 4 as we seem to have found a top in wave 3 right at MG1 around $320. Looking for support to be found on MG2 at $200.

SPOT Stock Analysis – Daily Chart

The daily chart indicates that SPOT seems to have found a top in wave 3 around MG1 at $320. We are now looking for support to be found around MG2 at $200 as Minor wave 4 continues to develop. Traders should monitor these levels closely for signs of bottoming out and potential reversal.
Spotify-Technology-S...


SPOT Elliott Wave Analysis Trading Lounge 4Hr Chart

Spotify Technology S.A. (SPOT) 4Hr Chart

SPOT Elliott Wave Technical Analysis

Function: Counter Trend

Mode: Corrective

Structure: Flat

Position: Wave {c} of 4

Direction: Downside in wave {c}

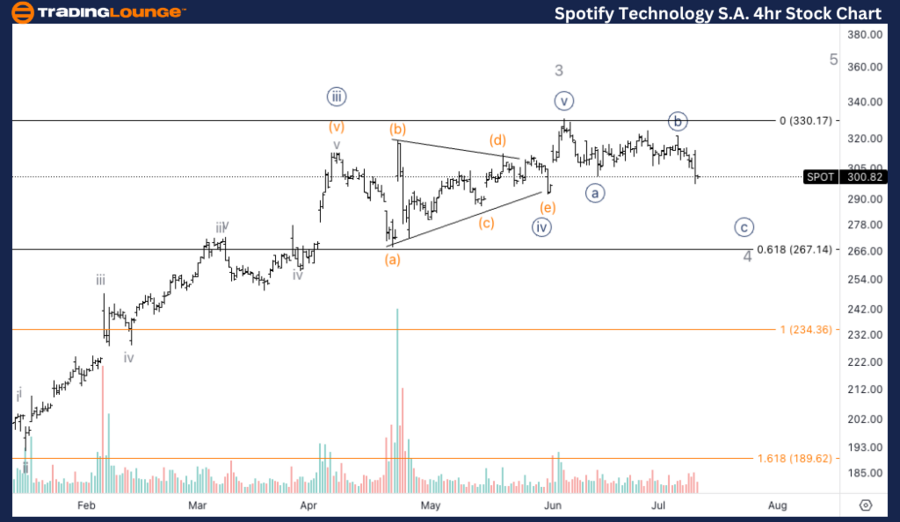
Details: Looking for downside into wave {c}, we have increased volume which suggests more downside should be coming, as well as 0.618 retracement of wave 4 vs. 2 stands at $265.

SPOT Technical Analysis – 4Hr Chart

The 4-hour chart shows that SPOT is targeting further downside in wave {c}. An increase in volume suggests more downside pressure, with the 0.618 retracement of wave 4 vs. wave 2 standing at $265. This level is critical for potential support and should be monitored for a reversal indication.

Technical Analyst: Alessio Barretta

Source: visit Tradinglounge.com and learn From the Experts Join TradingLounge Here 

See Previous: Deere & Co. (DE)t Wave Technical Analysis

Special Trial Offer - 0.76 Cents a Day for 3 Months! Click here

Access 7 Analysts Over 170 Markets Covered. Chat Room With Support
Spotify-Technology-S...

Related

Elliott Wave Technical Analysis of ChainLink Crypto Price News Today: A Comprehensive Guide

Elliott Wave Technical Analysis of ChainLink Crypto Price News Today: A Comprehensive Guide

This comprehensive guide offers a deep dive into Elliott Wave Analysis for ChainLink (LINKUSD), prov...

Read More >
State Bank of India (SBIN) Stock Analysis: Elliott Wave Technical Insights and Price Predictions

State Bank of India (SBIN) Stock Analysis: Elliott Wave Technical Insights and Price Predictions

State Bank of India (SBIN) is undergoing critical movements based on Elliott Wave analysis. The stoc...

Read More >
Axis Bank ltd. Elliott WaveTechnical Analysis: Stock Price Forecast, Resistance Levels, and Trading Strategy

Axis Bank ltd. Elliott WaveTechnical Analysis: Stock Price Forecast, Resistance Levels, and Trading Strategy

This article provides an in-depth Elliott Wave analysis of Axis Bank's stock, including technica...

Read More >
Caterpillar Inc.(CAT) Stocks Elliott Wave Technical Analysis: Highlights key Fibonacci retracement levels and potential reversal points

Caterpillar Inc.(CAT) Stocks Elliott Wave Technical Analysis: Highlights key Fibonacci retracement levels and potential reversal points

Our Elliott Wave analysis of Caterpillar Inc. (CAT) stock provides traders with detailed insights in...

Read More >
A detailed FTSE 100 (UK) Index Elliott Wave Technical Analysis: It Explores the current market trend

A detailed FTSE 100 (UK) Index Elliott Wave Technical Analysis: It Explores the current market trend

This article provides a detailed FTSE 100 Elliott Wave analysis for both day and weekly charts. It e...

Read More >
Technical Analysis of Adani Green Energy Stock with Elliott Wave Insights: Understand Share Price and Trends Movements

Technical Analysis of Adani Green Energy Stock with Elliott Wave Insights: Understand Share Price and Trends Movements

Dive into the technical analysis of Adani Green Energy stock with Elliott Wave insights. Understand ...

Read More >

Buy 1 Month

Get 3 Months!

Special Offer:

Trade Recommendations

Unleash the power of deversified trading with our comprehensive portfolio, covering:

  • Stock Trades
  • Crypto Trades
  • Forex Trades
  • Commodity Trades
Elliott Wave Analysis

Gain a competive edge with expert insights in to:

  • Global Indices
  • US Stocks & ASX Stocks
  • Forex & Crypto
  • Commodities
Top-Notch Trading Tools

Equip yourself with the tools of success:

  • Social Chat
  • Elliott Wave Algorithm
  • Screener
  • TradingLevels
  • Trading Game
7 Elliott Wave Analysts

Stay ahead of the market with daily charts and insightful videos
-Your secret to strategic trading!

JOIN HERE


Welcome to TradingLounge (ASIC A.R.No. 321187), specialists in trades, trading education and technical analysis, covering stocks, indices, commodities, forex and cryptocurrencies.

When you join TradingLounge you have access to everything we offer, including trade tools, educational content and a social platform to chat with like-minded investors.

Read more

@Copyright 2024 by tradinglounge.com

Contact Us

Australian no: 02 4787 6020

International no: +61 (2) 47876020

Pay with:

Find us on