20Jan

Amazon Inc. (AMZN) Elliott Wave Analysis: Amazon Stock Forecast, Market Trends, Trading Strategies, and Investment Insights

AMZN Elliott Wave Analysis – Daily and 1-Hour Chart Overview

This Elliott Wave analysis for Amazon.com Inc. (AMZN) examines both the daily and 1-hour charts, applying Elliott Wave Theory to evaluate the current market trend and forecast potential future price movements.


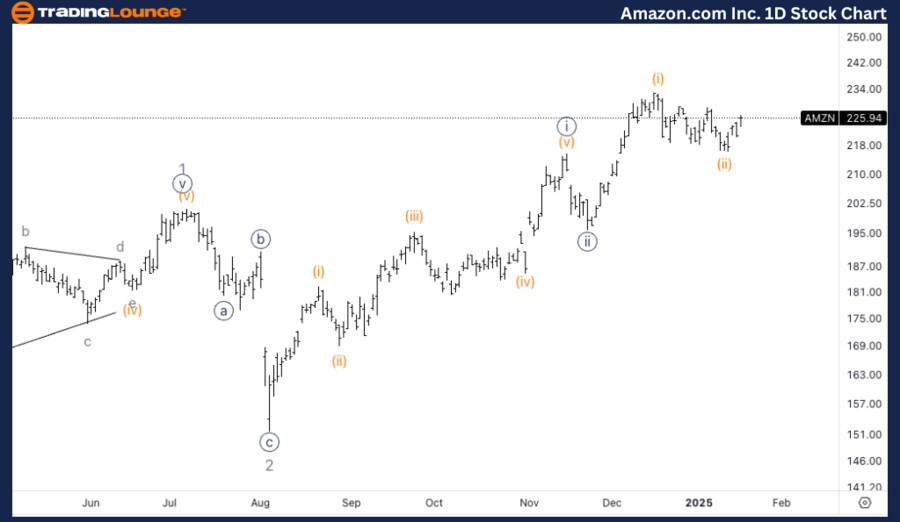
Amazon Inc. (AMZN) Elliott Wave Analysis – Daily Chart

AMZN Elliott Wave Technical Analysis

Function: Trend

Mode: Impulsive

Structure: Motive

Position: Minor wave 3

Direction: Upside within wave 3

Analysis Details:
We anticipate further upside momentum in wave 3, having completed wave {!}-{ii} around TradingLevel2 at $200. Currently, we are progressing higher within what appears to be Minute wave {iii}, indicating sustained bullish potential.

AMZN Elliott Wave Technical Analysis – Daily Chart Insights

The ongoing Elliott Wave pattern suggests a strong bullish outlook within Minor wave 3, with recent price action confirming the completion of wave {!}-{ii} at $200. The market structure remains solid, supporting an upward continuation into Minute wave {iii}, reinforcing the positive trend for AMZN.

Amazon-Inc-1d-stock-...


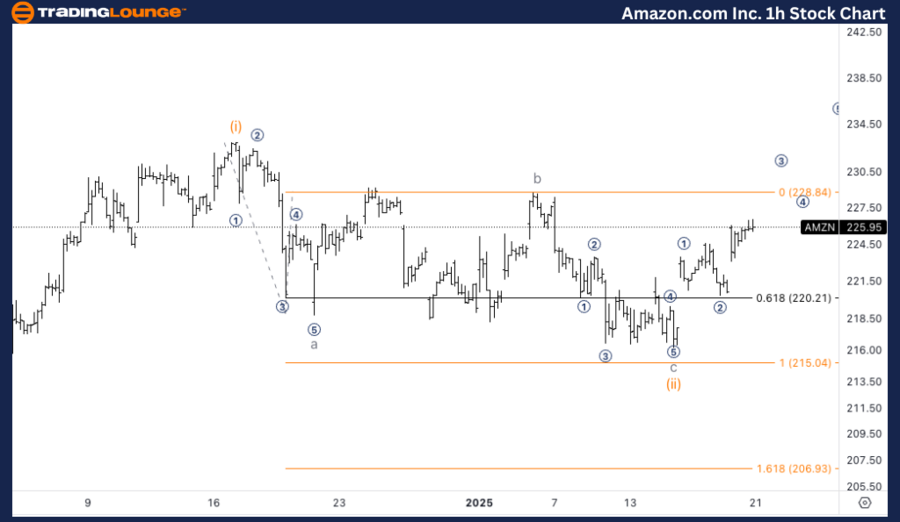
Amazon Inc. (AMZN) Elliott Wave Analysis – 1-Hour Chart

AMZN Elliott Wave Technical Analysis

Function: Trend

Mode: Impulsive

Structure: Motive

Position: Wave i of (iii)

Direction: Upside into wave (iii)

Analysis Details:
We expect further upside movement towards $220, providing additional confirmation of the uptrend resumption. The price action indicates a clear three-wave move subdivision in wave (ii), and a break above $220 will solidify the bullish market structure.

AMZN Elliott Wave Technical Analysis – 1H Chart Insights

Current market behavior supports further gains, with projections targeting $220 for a stronger bullish confirmation. The observed Elliott Wave pattern highlights a well-structured wave (ii) subdivision, pointing to further price appreciation within wave (iii).

Technical Analyst: Alessio Barretta

Source: visit Tradinglounge.com and learn From the Experts Join TradingLounge Here 

See Previous: Berkshire Hathaway Inc. (BRK.B) Elliott Wave Technical Analysis

VALUE Offer - Buy 1 Month & Get 3 Months!Click here

Access 7 Analysts Over 200 Markets Covered. Chat Room With Support

Amazon-Inc-1h-stock-...

Related

Uniswap Crypto Forecast: Elliott Wave Signals Bullish Reversal – UNIUSD Trading Strategy, Price Targets & Key Breakout Levels

Uniswap Crypto Forecast: Elliott Wave Signals Bullish Reversal – UNIUSD Trading Strategy, Price Targets & Key Breakout Levels

Uniswap (UNIUSD) shows signs of a completed Elliott Wave correction, hinting at a bullish reversal n...

Read More >
ASX FPH Stock Analysis: Fisher & Paykel Healthcare Elliott Wave Forecast, Wave 4 Triangle Pattern, and Price Prediction Insights

ASX FPH Stock Analysis: Fisher & Paykel Healthcare Elliott Wave Forecast, Wave 4 Triangle Pattern, and Price Prediction Insights

Elliott Wave analysis for ASX: FPH (Fisher & Paykel Healthcare Corporation Limited). Our technical a...

Read More >
Ethereum (ETHUSD) Elliott Wave Analysis Shows Wave 2 Correction Targeting $2,295–$2,250 Zone with Wave 3

Ethereum (ETHUSD) Elliott Wave Analysis Shows Wave 2 Correction Targeting $2,295–$2,250 Zone with Wave 3

Ethereum (ETHUSD) is undergoing a wave 2 pullback in Elliott Wave terms, with key support at the $2,...

Read More >
Caterpillar Inc. Elliott Wave Technical Analysis: Corrective Wave Trends, Technical Patterns, and Price Target Insights for Traders

Caterpillar Inc. Elliott Wave Technical Analysis: Corrective Wave Trends, Technical Patterns, and Price Target Insights for Traders

Caterpillar Inc. (CAT), highlighting potential bottom formations in wave {iv} and future price targe...

Read More >
TASI Index Elliott Wave Analysis Forecasts Bullish Trend in Saudi Stock Market with Strategic Trading Setup and Technical Insights

TASI Index Elliott Wave Analysis Forecasts Bullish Trend in Saudi Stock Market with Strategic Trading Setup and Technical Insights

A detailed Elliott Wave analysis of the TASI Index shows that a bullish trend is developing. Learn S...

Read More >
Maximize Your Trading Success: Expert Elliott Wave Analysis for NASDAQ and Top Tech Stocks

Maximize Your Trading Success: Expert Elliott Wave Analysis for NASDAQ and Top Tech Stocks

This content revolves around providing advanced Elliott Wave analysis and trading strategies for the...

Read More >

$1 for 2 Weeks

then $29 a month!

What a Special Offer!

Trade Recommendations

Unleash the power of deversified trading with our comprehensive portfolio, covering 250+ markets:

  • Stock Trades
  • Crypto Trades
  • Forex Trades
  • Commodity Trades
Elliott Wave Analysis

Gain a competitive edge with expert insights and AI-powered Elliott Wave charting into:

  • Global Indices
  • US Stocks & ASX Stocks
  • Forex & Crypto
  • Commodities
Top-Notch Trading Tools

Equip yourself with the tools of success:

  • Real-time Chat rooms
  • Elliott Wave Algorithm
  • Portfolio tools
  • TradingLevels
  • Screener
  • Trading Game
7 Elliott Wave Analysts

Stay ahead of the market with daily charts and insightful videos
Your secret to strategic trading!

JOIN HERE


Welcome to TradingLounge (ASIC A.R.No. 321187), specialists in trades, trading education and technical analysis, covering stocks, indices, commodities, forex and cryptocurrencies.

When you join TradingLounge you have access to everything we offer, including trade tools, educational content and a social platform to chat with like-minded investors.

Read more

@Copyright 2024 by tradinglounge.com

Contact Us

Australian no: 02 4787 6020

International no: +61 (2) 47876020

Pay with:

Find us on