This analysis of Visa Inc. (V) examines both the daily and 1-hour charts, leveraging the principles of Elliott Wave Theory to evaluate current market dynamics and project future price movements.
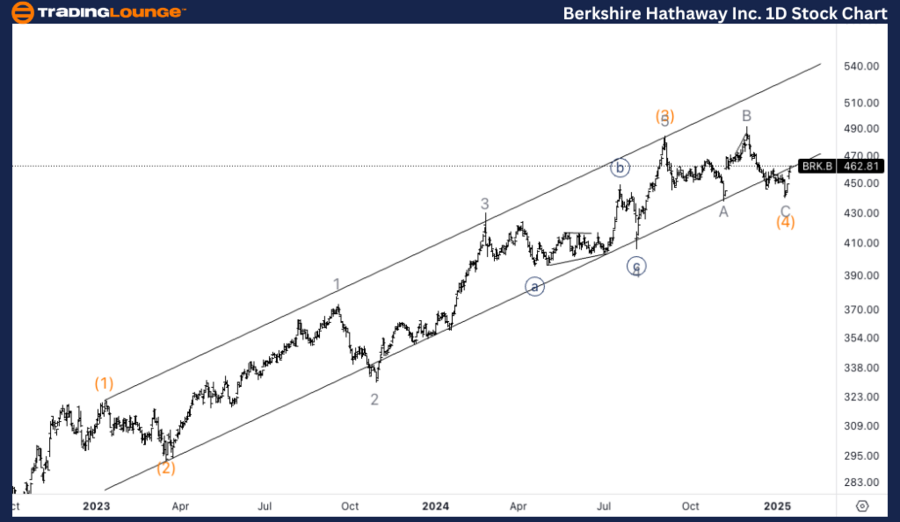
Berkshire Hathaway Inc. (BRK.B) Elliott Wave Analysis – Trading Lounge Daily Chart
BRK.B Elliott Wave Technical Analysis
Function: Trend
Mode: Impulsive
Structure: Motive
Position: Wave 1 of (5)
Direction: Upside in wave 1
Daily Chart Analysis: BRK.B Elliott Wave
We are observing the potential formation of a wave (4) bottom, with the price touching the base of the parallel trend channel and responding sharply in an impulsive manner over the past week. This development suggests the commencement of wave 1 of the final leg (wave 5) and points toward a continuation of the uptrend.

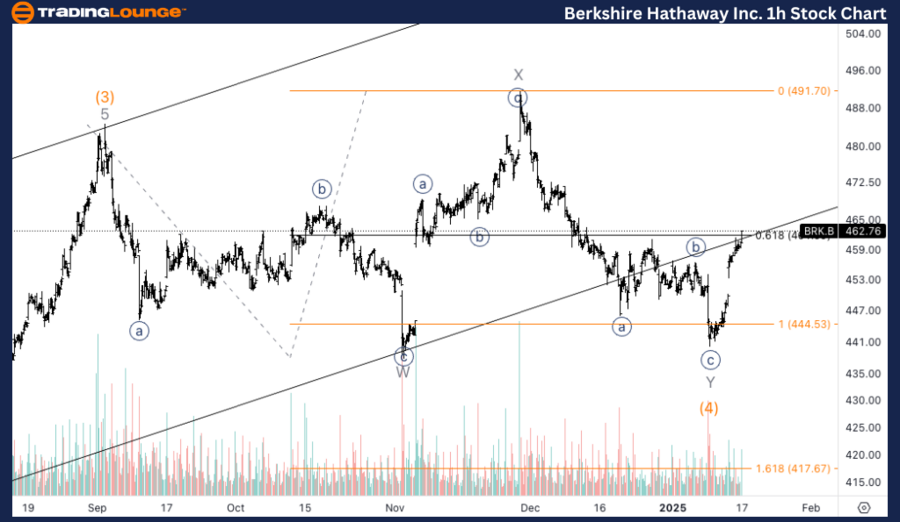
Berkshire Hathaway Inc. (BRK.B) Elliott Wave Analysis – Trading Lounge 1-Hour Chart
BRK.B Elliott Wave Technical Analysis
Function: Trend
Mode: Impulsive
Structure: Motive
Position: Wave 1 of (5)
Direction: Upside in wave 1
1-Hour Chart Analysis: BRK.B Elliott Wave
Zooming in, the 1-hour chart reveals a complex corrective structure, appearing as a double three (three waves of threes). The robust upward reaction from the equality level of Y vs. W bolsters confidence in the bullish outlook. We anticipate that wave 1 of (5) will unfold next, continuing the upward momentum.
Technical Analyst: Alessio Barretta
Source: visit Tradinglounge.com and learn From the Experts Join TradingLounge Here
See Previous: Advanced Micro Devices Inc. (AMD) Elliott Wave Technical Analysis
VALUE Offer - Buy 1 Month & Get 3 Months!Click here
Access 7 Analysts Over 200 Markets Covered. Chat Room With Support
