DOW JONES – DJI Elliott Wave Analysis Trading Lounge Day Chart

DOW JONES – DJI Elliott Wave Technical Analysis

  • Function: Bullish Trend

  • Mode: Impulsive

  • Structure: Gray Wave 3

  • Position: Orange Wave 3

  • Direction Next Lower Degrees: Gray Wave 4

  • Wave Cancel Invalid Level: 41,823.80

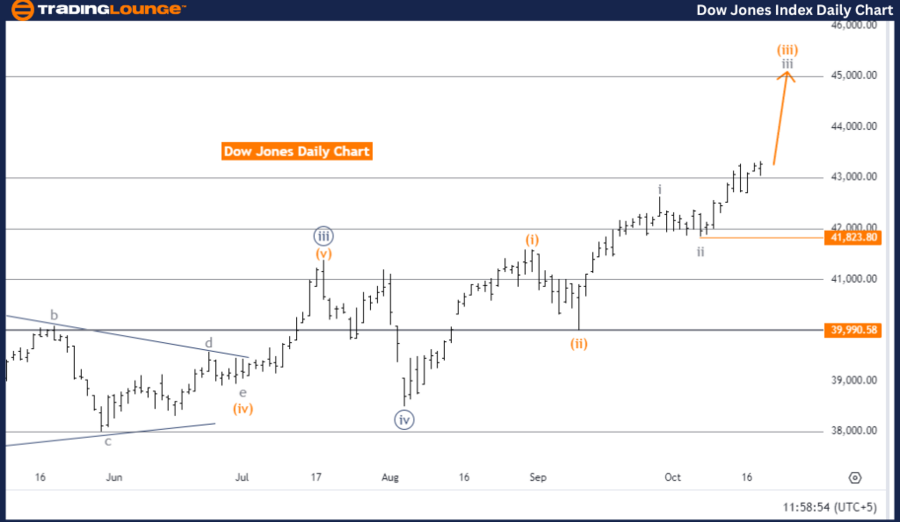
The Elliott Wave analysis for the Dow Jones (DJI) on the daily chart reveals that the market is in a bullish trend, operating in an impulsive mode. The current structure is Gray Wave 3, which highlights the continuation of upward momentum. This bullish phase is a part of a larger wave structure, suggesting that the market's upward trajectory is expected to continue.

Presently, the market is positioned in Orange Wave 3, a subdivision of the larger Gray Wave 3. This phase reflects strong upward movement, characterized by higher highs and higher lows. The prior Gray Wave 2 appears to have been completed, giving way to the ongoing advance of Gray Wave 3. This impulsive wave is expected to drive the market further upward.

As per the analysis, Gray Wave 4 is anticipated next, following the completion of Gray Wave 3. This upcoming phase is likely to represent a corrective pullback or consolidation before the bullish trend resumes.

Traders are closely watching the wave cancellation level at 41,823.80. If the price falls below this level, the current wave structure would be invalidated, leading to a re-evaluation of the Elliott Wave count. As long as this level holds, the bullish trend is expected to persist, with Gray Wave 3 continuing its development.

Summary

The Dow Jones daily chart shows a strong bullish trend, with the market currently in Gray Wave 3, particularly within Orange Wave 3. The completion of Gray Wave 2 has triggered the current impulsive upward movement, with Gray Wave 4 expected next. The key level to watch for invalidation is 41,823.80.

DOW-JONES-Index-Dail...


DOW JONES – DJI Elliott Wave Analysis Trading Lounge Weekly Chart

DOW JONES – DJI Elliott Wave Technical Analysis

  • Function: Bullish Trend

  • Mode: Impulsive

  • Structure: Orange Wave 3

  • Position: Navy Blue Wave 5

  • Direction Next Lower Degrees: Orange Wave 4

  • Wave Cancel Invalid Level: 39,990.58

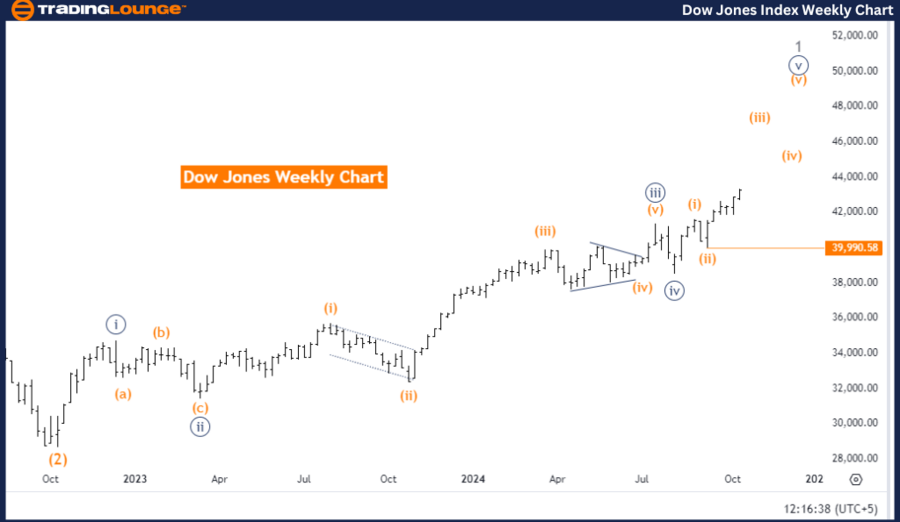
The Elliott Wave analysis for the Dow Jones (DJI) on the weekly chart highlights a continued bullish trend, operating in impulsive mode. The focus is on Orange Wave 3, which reflects ongoing upward momentum. This impulsive phase suggests strong buying pressure and a likely push towards higher prices.

The market is currently positioned in Navy Blue Wave 5, which is part of the larger Orange Wave 3 structure. The prior Orange Wave 2 appears to have completed, signaling the end of the corrective phase and the resumption of the bullish trend. The development of Orange Wave 3 is expected to propel the market higher, reinforcing the overall positive outlook.

Following the completion of Orange Wave 3, the next phase is anticipated to be Orange Wave 4, likely a corrective pullback or consolidation. However, for now, the emphasis remains on the progression of Orange Wave 3, which is driving the current bullish movement.

The wave cancellation level at 39,990.58 is crucial for traders. If the price falls below this level, the current wave structure will be invalidated, necessitating a reassessment of the Elliott Wave analysis. As long as this level holds, the market is expected to continue its upward trend, with Orange Wave 3 leading the charge.

Summary

The Dow Jones weekly chart reflects a bullish trend, with the market situated in Navy Blue Wave 5, a part of the broader Orange Wave 3. The completion of Orange Wave 2 has led to the current bullish rise in Orange Wave 3, with Orange Wave 4 expected as the next corrective phase. The critical invalidation level is set at 39,990.58.

Technical Analyst: Malik Awais

Source: visit Tradinglounge.com and learn From the Experts Join TradingLounge Here 

Previous: CAC 40 Elliott Wave Technical Analysis

VALUE Offer - Buy 1 Month & Get 3 Months!Click here

Access 7 Analysts Over 200 Markets Covered. Chat Room With Support

DOW-JONES-Index-Week...

Related

Euro Stoxx 50 Index Elliott Wave Technical Analysis: Exploring Top Stocks to Buy, Watching for Bullish Trends, and Strategic Advice

Euro Stoxx 50 Index Elliott Wave Technical Analysis: Exploring Top Stocks to Buy, Watching for Bullish Trends, and Strategic Advice

Get a complete overview of Euro Stoxx 50 trading with our in-depth analysis using Elliott Wave princ...

Read More >
Elliott Wave Trading Strategies for SP500, NASDAQ 100 & Leading Tech Stocks

Elliott Wave Trading Strategies for SP500, NASDAQ 100 & Leading Tech Stocks

Elliott Wave analysis shows major indices and leading tech stocks in corrective Wave (4), setting up...

Read More >
Learn Whether ANZ Group Holdings Limited Shares are a Buy or Sell – ANZ Elliott Wave Analysis & Technical Forecast

Learn Whether ANZ Group Holdings Limited Shares are a Buy or Sell – ANZ Elliott Wave Analysis & Technical Forecast

This Elliott Wave analysis of ASX: ANZ GROUP HOLDINGS LIMITED provides a detailed breakdown of ANZ s...

Read More >
Euro/British Pound(EURGBP) Elliott Wave Technical Analysis 1 November 23

Euro/British Pound(EURGBP) Elliott Wave Technical Analysis 1 November 23

The "EURGBP Elliott Wave Analysis Trading Lounge Day Chart" dated 1 November 23, offers an...

Read More >
Elliott Wave Analysis: Uncover Trading Strategies on S&P 500, NASDAQ 100, DAX 40, FTSE 100 & ASX 200

Elliott Wave Analysis: Uncover Trading Strategies on S&P 500, NASDAQ 100, DAX 40, FTSE 100 & ASX 200

Our latest blog post delves into Elliott Wave analysis on major indices like the S&P 500, NASDAQ 100...

Read More >
Hang Seng Index Elliott Wave Technical Analysis: Market Trends, Wave Count, Price Prediction, and Trading Strategy for Investors

Hang Seng Index Elliott Wave Technical Analysis: Market Trends, Wave Count, Price Prediction, and Trading Strategy for Investors

Elliott Wave analysis of the Hang Seng Index, covering both daily and weekly chart forecasts. It exa...

Read More >

$1 for 2 Weeks

then $29 a month!

What a Special Offer!

Trade Recommendations

Unleash the power of deversified trading with our comprehensive portfolio, covering 250+ markets:

  • Stock Trades
  • Crypto Trades
  • Forex Trades
  • Commodity Trades
Elliott Wave Analysis

Gain a competitive edge with expert insights and AI-powered Elliott Wave charting into:

  • Global Indices
  • US Stocks & ASX Stocks
  • Forex & Crypto
  • Commodities
Top-Notch Trading Tools

Equip yourself with the tools of success:

  • Real-time Chat rooms
  • Elliott Wave Algorithm
  • Portfolio tools
  • TradingLevels
  • Screener
  • Trading Game
7 Elliott Wave Analysts

Stay ahead of the market with daily charts and insightful videos
Your secret to strategic trading!

JOIN HERE


Welcome to TradingLounge (ASIC A.R.No. 321187), specialists in trades, trading education and technical analysis, covering stocks, indices, commodities, forex and cryptocurrencies.

When you join TradingLounge you have access to everything we offer, including trade tools, educational content and a social platform to chat with like-minded investors.

Read more

@Copyright 2024 by tradinglounge.com

Contact Us

Australian no: 02 4787 6020

International no: +61 (2) 47876020

Pay with:

Find us on