ASX: Insurance Australia Group Limited (IAG) – Elliott Wave Analysis by TradingLounge
Hello traders,
In today's Elliott Wave breakdown, we examine Insurance Australia Group Limited (ASX: IAG). The current wave structure suggests IAG is still in a corrective phase. A short-term dip may occur before a potential trend reversal upward develops.
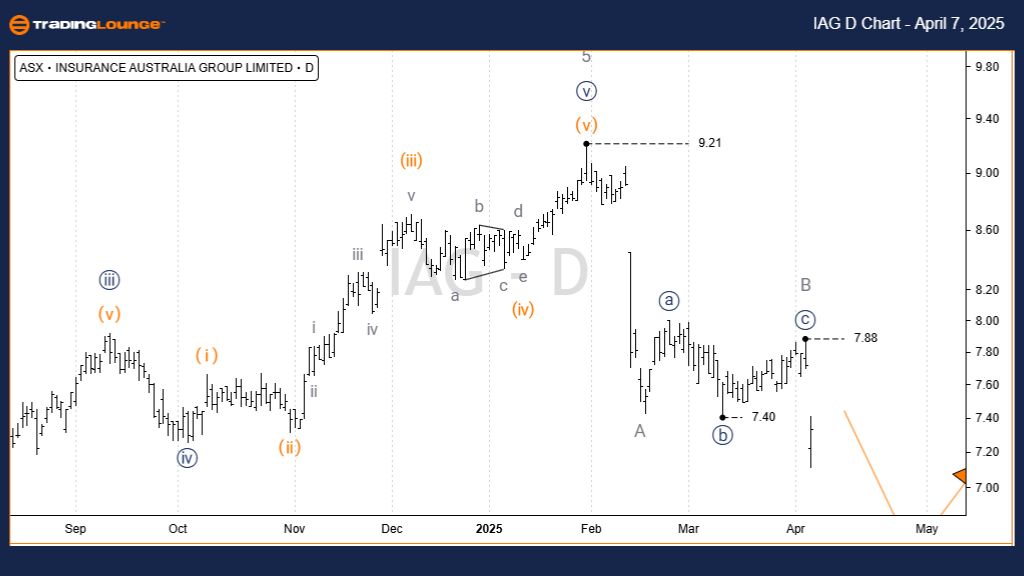
IAG Elliott Wave Technical Summary – 1-Day Chart (Semilog Scale)
Trend Level: Primary (Navy)
Wave Type: Motive
Wave Structure: Impulse
Current Position: Wave C (grey) of Wave (4) (orange)
Technical Analysis Highlights:
- Wave (4) in orange continues its correction phase, following the completion of Wave (3) in orange.
- Price action aligns with the 38.2% Fibonacci retracement zone.
- Wave B (grey) has ended, and Wave C (grey) is progressing lower.
- Key support zone lies between 6.66 and 6.36, suggesting a potential bounce area.
Invalidation Level: 7.88
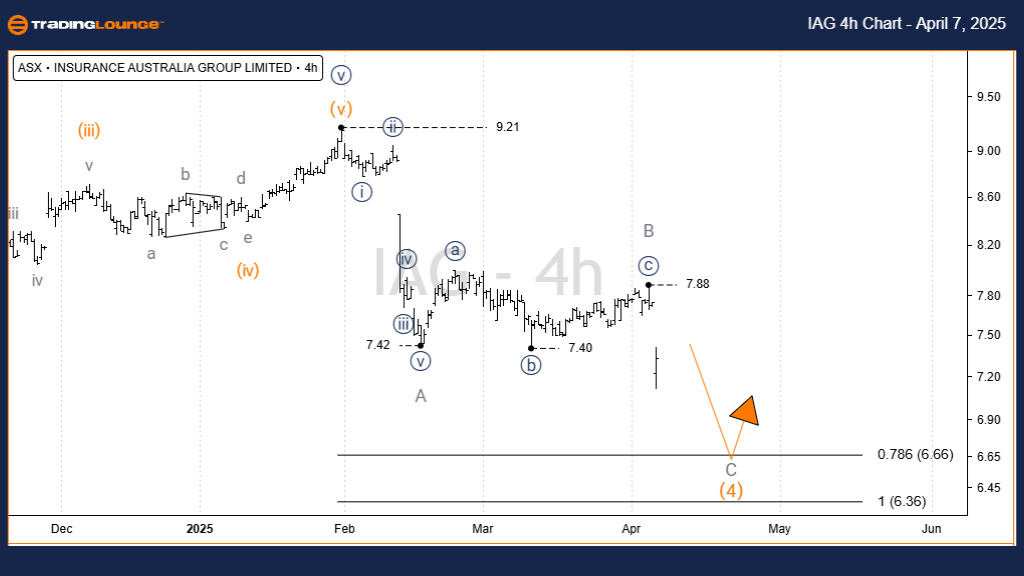
ASX: Insurance Australia Group Limited IAG Elliott Wave Technical Summary – 4-Hour Chart
Trend Level: Intermediate (Orange)
Wave Type: Motive
Wave Structure: Impulse
Current Position: Wave C (grey) of Wave (4) (orange)
Technical Analysis Highlights:
- From the 7.42 low, Wave B (grey) formed a Running Flat pattern: ((a))((b))((c)) in navy.
- After the 7.88 high, Wave C (grey) began declining.
- Downside targets fall within the established 6.66–6.36 range.
Invalidation Level: 7.88
Technical Analyst: Hua (Shane) Cuong, CEWA-M (Master’s Designation).
Source: Visit Tradinglounge.com and learn from the Experts. Join TradingLounge Here
See Previous: NEWS CORPORATION (NWS) Elliott Wave Technical Analysis
VALUE Offer - Buy 1 Month & Get 3 Months!Click here
Access 7 Analysts Over 200 Markets Covered. Chat Room With Support
Conclusion:
The Elliott Wave outlook for ASX: IAG presents actionable insight into both short-term corrections and the broader trend structure. With clear wave labeling and a focus on Fibonacci retracement zones, traders gain enhanced confidence. The identified invalidation level at 7.88 adds clarity to risk management strategies. This analysis delivers practical, data-driven guidance for navigating current market dynamics.