26Nov

S&P 500 Index Elliott Wave Technical Analysis: Learn About Bullish Trends, Impulsive Wave Structures, and Corrective Wave Forecasts

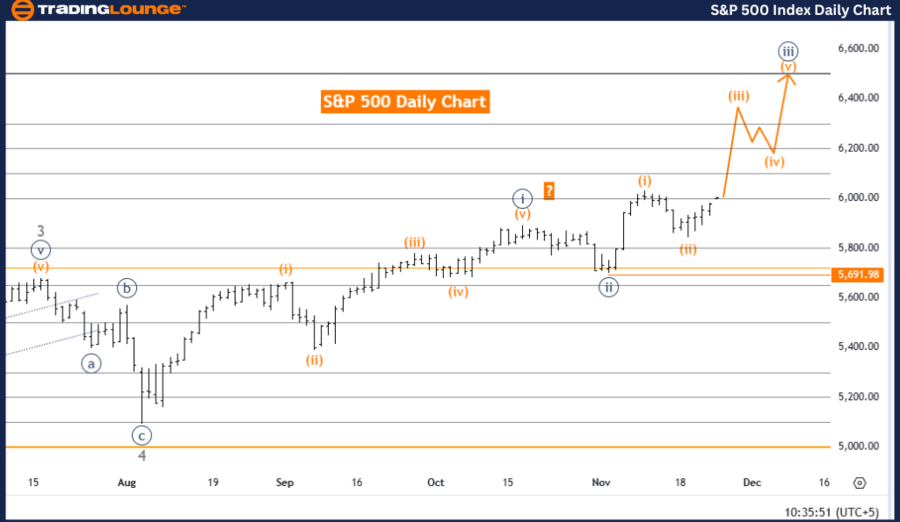
S&P 500 Elliott Wave Analysis - TradingLounge Daily Chart

S&P 500 Index Daily Chart Analysis

S&P 500 Elliott Wave Technical Analysis

Function: Bullish Trend

Mode: Impulsive

Structure: Orange Wave 3

Position: Navy Blue Wave 3

Next Lower Degree Direction: Orange Wave 4

Details:

  • Orange wave 2 has likely concluded, with orange wave 3 of navy blue wave 3 currently developing.

Invalidation Level: 5,691.98

Analysis Summary:

This analysis applies Elliott Wave theory to the S&P 500 daily chart, identifying a bullish trend in progress. The current mode is impulsive, indicative of strong upward momentum.

Key Points:

  • The analysis focuses on orange wave 3, which began after the completion of orange wave 2, signaling continued bullish movement.
  • The S&P 500 is positioned within navy blue wave 3, with orange wave 3 propelling this phase of the market.
  • The next projected movement is a corrective phase, orange wave 4, expected to follow the completion of orange wave 3.

Critical Benchmark for Validation:

The invalidation level is defined at 5,691.98. A drop to this level invalidates the current Elliott Wave count and the bullish outlook, emphasizing the importance of this threshold for risk management.

Conclusion:

The Elliott Wave analysis for the S&P 500 daily chart points to a bullish trend, with orange wave 3 within navy blue wave 3 driving upward movement. The conclusion of orange wave 2 confirms the impulsive phase, and the robust momentum suggests more gains ahead. The trend remains valid as long as the index remains above 5,691.98, with further growth expected before transitioning to the corrective orange wave 4 phase.

S&P-500-Index-Daily-...


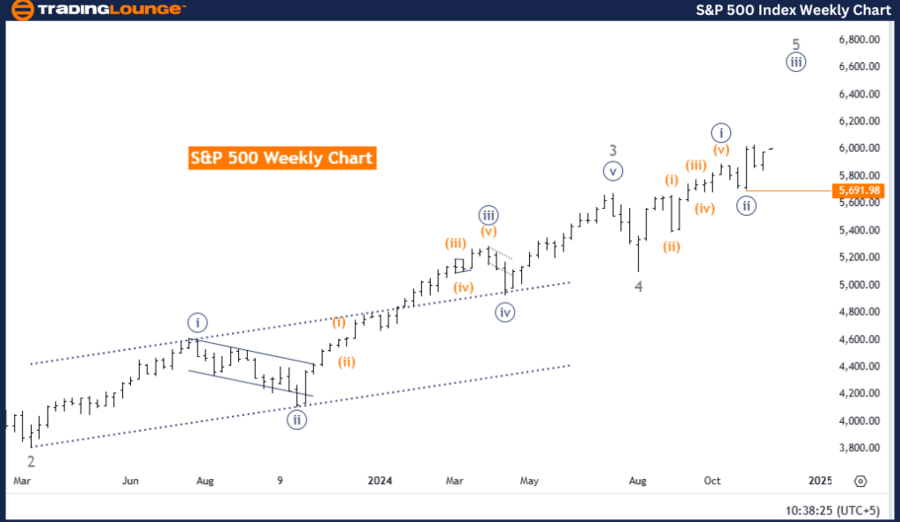
S&P 500 Elliott Wave Analysis - TradingLounge Weekly Chart

S&P 500 Elliott Wave Technical Analysis

Function: Bullish Trend

Mode: Impulsive

Structure: Navy Blue Wave 3

Position: Gray Wave 5

Next Lower Degree Direction: Navy Blue Wave 4

Details:

  • Navy blue wave 2 has likely completed, with navy blue wave 3 of gray wave 5 now underway.

Invalidation Level: 5,691.98

S&P 500 Analysis Summary:

This analysis evaluates the S&P 500 using Elliott Wave theory on a weekly timeframe, highlighting an ongoing bullish trend. The impulsive mode reflects sustained upward movement.

Key Points:

  • The focus is on navy blue wave 3, initiated after the completion of navy blue wave 2, continuing the long-term bullish trend.
  • The market is advancing within gray wave 5, the final upward phase of this impulsive movement.
  • The next anticipated development is navy blue wave 4, a corrective phase expected to follow navy blue wave 3.

Critical Benchmark for Validation:

The invalidation level is defined at 5,691.98. A decline to this point invalidates the current wave count and bullish scenario. This benchmark is key for confirming the trend and managing risks.

Conclusion:

The weekly Elliott Wave analysis underscores a bullish phase, with navy blue wave 3 within gray wave 5 driving the market higher. The completion of navy blue wave 2 confirms this impulsive phase, with strong momentum suggesting continued gains. The bullish outlook remains intact as long as the index stays above 5,691.98. Expect upward potential before the market transitions into the corrective navy blue wave 4 phase.

Technical Analyst: Malik Awais

Source: visit Tradinglounge.com and learn From the Experts Join TradingLounge Here 

Previous: S&P/ASX 200 Elliott Wave Technical Analysis

VALUE Offer - Buy 1 Month & Get 3 Months!Click here

Access 7 Analysts Over 200 Markets Covered. Chat Room With Support

S&P-500-Index-Weekly...

Related

Netflix Inc.(NFLX:NYSE) Elliott Wave Technical Analysis 23 January 24

Netflix Inc.(NFLX:NYSE) Elliott Wave Technical Analysis 23 January 24

TradingLounge 4-hour and 1-hour Chart for Netflix Inc.(NFLX:NYSE) Elliott Wave Technical Analysis da...

Read More >
Navigate the Upcoming Corrections and Future Waves in the Cardano Crypto Market: ADAUSD Elliott Wave Technical Analysis

Navigate the Upcoming Corrections and Future Waves in the Cardano Crypto Market: ADAUSD Elliott Wave Technical Analysis

This article provides a detailed Elliott Wave analysis of Cardano (ADAUSD), offering predictions on ...

Read More >
Elliott Wave analysis for Meta Platforms Inc. (META) Stock, Covering both Daily and 4-hour charts Technical Analysis

Elliott Wave analysis for Meta Platforms Inc. (META) Stock, Covering both Daily and 4-hour charts Technical Analysis

This article provides a detailed Elliott Wave analysis for Meta Platforms Inc. (META), covering both...

Read More >
Eli Lilly & Co. (LLY) Elliott Wave Technical Analysis: Focusing on Stock Forecasts, Technical Chart Patterns, and Trading Strategies

Eli Lilly & Co. (LLY) Elliott Wave Technical Analysis: Focusing on Stock Forecasts, Technical Chart Patterns, and Trading Strategies

This article offers a detailed Elliott Wave analysis of Eli Lilly & Co. (LLY), focusing on stock for...

Read More >
BHP Group Limited Utilizes Elliott Wave theory to Provide Detailed Insights into BHP Stock Trends, Price Predictions

BHP Group Limited Utilizes Elliott Wave theory to Provide Detailed Insights into BHP Stock Trends, Price Predictions

This comprehensive analysis of ASX: BHP Group Limited utilizes Elliott Wave theory to provide detail...

Read More >
Navigating the Bullish Cycle: Elliott Wave Analysis and Trading Strategies for NASDAQ Tech Stocks

Navigating the Bullish Cycle: Elliott Wave Analysis and Trading Strategies for NASDAQ Tech Stocks

The NASDAQ 100, SP500, and major tech stocks like Apple, Tesla, Amazon, and others are currently in ...

Read More >

Buy 1 Month

Get 3 Months!

Special Offer:

Trade Recommendations

Unleash the power of deversified trading with our comprehensive portfolio, covering:

  • Stock Trades
  • Crypto Trades
  • Forex Trades
  • Commodity Trades
Elliott Wave Analysis

Gain a competive edge with expert insights in to:

  • Global Indices
  • US Stocks & ASX Stocks
  • Forex & Crypto
  • Commodities
Top-Notch Trading Tools

Equip yourself with the tools of success:

  • Social Chat
  • Elliott Wave Algorithm
  • Screener
  • TradingLevels
  • Trading Game
7 Elliott Wave Analysts

Stay ahead of the market with daily charts and insightful videos
-Your secret to strategic trading!

JOIN HERE


Welcome to TradingLounge (ASIC A.R.No. 321187), specialists in trades, trading education and technical analysis, covering stocks, indices, commodities, forex and cryptocurrencies.

When you join TradingLounge you have access to everything we offer, including trade tools, educational content and a social platform to chat with like-minded investors.

Read more

@Copyright 2024 by tradinglounge.com

Contact Us

Australian no: 02 4787 6020

International no: +61 (2) 47876020

Pay with:

Find us on