S&P/ASX 200 Elliott Wave Analysis: Trading Lounge Day Chart
S&P/ASX 200 Index Day Chart Analysis
S&P/ASX 200 Elliott Wave Technical Analysis
Function: Bullish Trend
Mode: Impulsive
Structure: Gray Wave 3
Position: Orange Wave 3
Direction (Next Higher Degrees): Gray Wave 3 (in progress)
Details: Gray wave 2 is complete, and gray wave 3 is actively advancing.
Wave Cancel Invalidation Level: 8,066.9
S&P/ASX 200 Index Market Analysis Overview
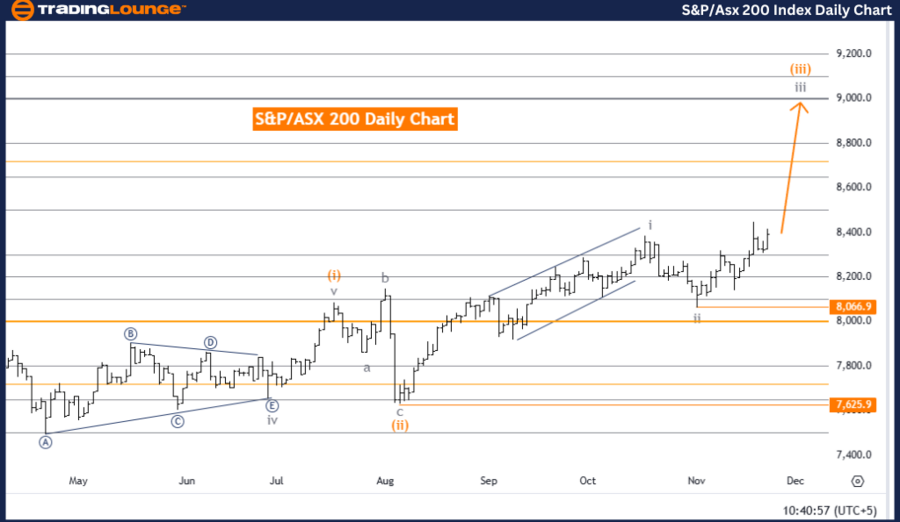
This analysis leverages Elliott Wave theory on the daily chart for the S&P/ASX 200 index, confirming a bullish trend characterized by an impulsive mode.
Key Wave Structure:
- Current Focus: Gray wave 3, initiated after the completion of gray wave 2, signifies the start of a strong upward momentum.
- Current Position: Orange wave 3, a sub-wave within gray wave 3, propels the ongoing bullish phase.
Next Market Movements
The index is expected to continue its upward trajectory as gray wave 3 progresses, signaling further bullish momentum and potential gains.
Invalidation Level:
A critical invalidation threshold of 8,066.9 is established. If the index declines to this level, the current wave count and bullish projection will be invalidated, necessitating a review of the trend and possible trading adjustments. This level serves as a key point for risk management and strategic planning.
Conclusion
Elliott Wave analysis underscores the S&P/ASX 200 index's bullish outlook, driven by gray wave 3:
- The completion of gray wave 2 marks the start of this upward trend.
- Orange wave 3 is powering the current rally within gray wave 3, reinforcing sustained bullish momentum.
- Traders should monitor the invalidation level at 8,066.9 closely, adjusting strategies as needed if this level is breached.
The index is poised to maintain its bullish trajectory, offering traders opportunities to capitalize on the ongoing wave progression.
S&P/ASX 200 Elliott Wave Analysis: Trading Lounge Weekly Chart
S&P/ASX 200 Elliott Wave Technical Analysis
Function: Bullish Trend
Mode: Impulsive
Structure: Gray Wave 3
Position: Orange Wave 3
Direction (Next Lower Degrees): Gray Wave 4
Details: Gray wave 2 is confirmed complete, and gray wave 3 is now progressing.
Wave Cancel Invalidation Level: 8,066.9
Market Analysis Overview
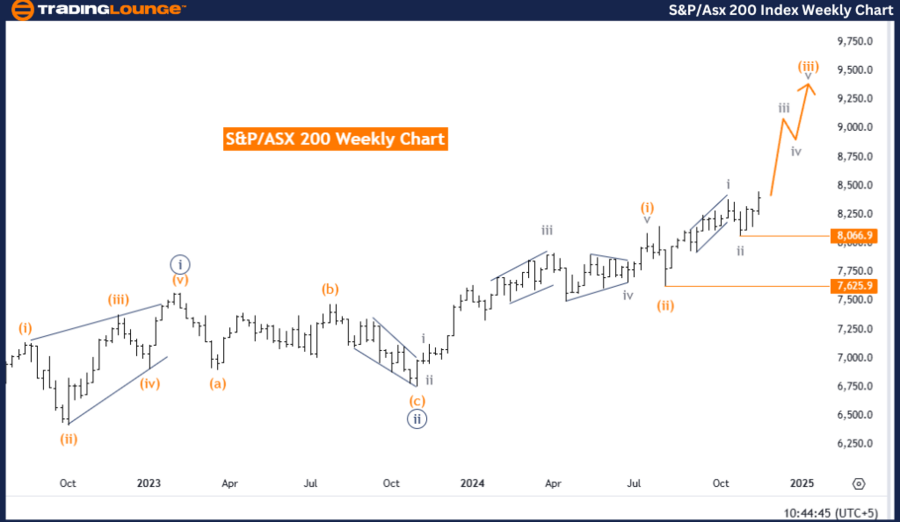
This Elliott Wave analysis on the weekly chart reinforces a bullish trend for the S&P/ASX 200 index, with a clear impulsive mode identified.
Key Wave Structure:
- Primary Focus: Gray wave 3 began following the conclusion of gray wave 2, marking a robust bullish phase.
- Current Position: Orange wave 3, a sub-wave of gray wave 3, is driving the ongoing upward momentum.
Next Market Movements
As gray wave 3 progresses, the bullish momentum is expected to sustain. Once gray wave 3 completes, the market is anticipated to transition into the corrective gray wave 4 phase.
- Invalidation Level:
A key invalidation level is set at 8,066.9, below which the current wave count and bullish outlook will be invalidated. This serves as a crucial risk management point for traders to reassess strategies.
Technical Analyst: Malik Awais
Source: visit Tradinglounge.com and learn From the Experts Join TradingLounge Here
Previous: IBEX 35 (Spain) Elliott Wave Technical Analysis
VALUE Offer - Buy 1 Month & Get 3 Months!Click here
Access 7 Analysts Over 200 Markets Covered. Chat Room With Support
Conclusion
The weekly Elliott Wave analysis highlights the ongoing bullish trend in the S&P/ASX 200 index:
- The end of gray wave 2 confirms the onset of gray wave 3.
- Orange wave 3 is leading the upward momentum within the larger structure.
- The bullish scenario remains intact as long as the index holds above the invalidation level at 8,066.9.
The analysis projects further gains within gray wave 3 before transitioning to gray wave 4, offering traders valuable insights to align their strategies with the prevailing trend.