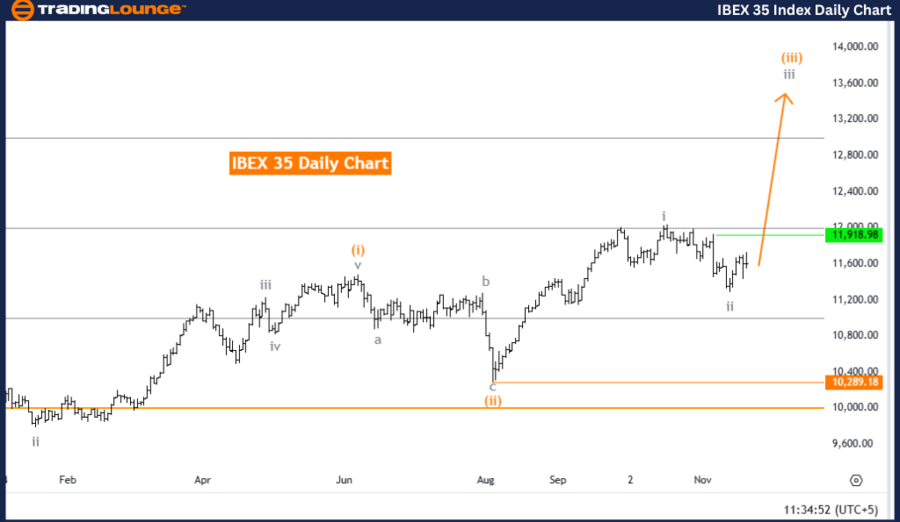
IBEX 35 (Spain) Elliott Wave Analysis Trading Lounge Day Chart
IBEX 35 (Spain) Elliott Wave Technical Analysis
Function: Bullish Trend
Mode: Impulsive
Structure: Gray wave 3
Position: Orange wave 3
Direction (Next Higher Degrees): Gray wave 3 (started)
Details: Gray wave 2 appears completed; gray wave 3 of orange wave 3 is now in progress.
Wave Cancel Invalid Level: 10,289.18
The IBEX 35 daily chart confirms a bullish trend, as outlined through Elliott Wave analysis. This current phase is characterized by an impulsive mode and centers on gray wave 3, which is actively advancing in a broader upward trend. The market is progressing through orange wave 3, signaling a robust continuation of the bullish momentum.
The earlier phase, gray wave 2, has likely concluded, making way for gray wave 3 of orange wave 3. This transition reflects continued upward movement, propelled by the strong bullish dynamics present in the market.
An invalidation level has been marked at 10,289.18. If prices fall below this level, the present Elliott Wave count would be deemed invalid, requiring a reevaluation of the market's wave structure and direction.
Key Takeaways:
-
Bullish momentum is driven by gray wave 3 of orange wave 3.
-
Gray wave 2 is complete, supporting the continuation of the current uptrend.
-
Traders must monitor the invalidation level of 10,289.18 to verify the accuracy of this wave count.
In summary, the IBEX 35 daily chart depicts a bullish outlook, with gray wave 3 advancing within an impulsive framework. The completion of gray wave 2 strengthens the current wave structure. Investors should remain vigilant for any price action near the invalidation threshold to adapt their strategies accordingly.
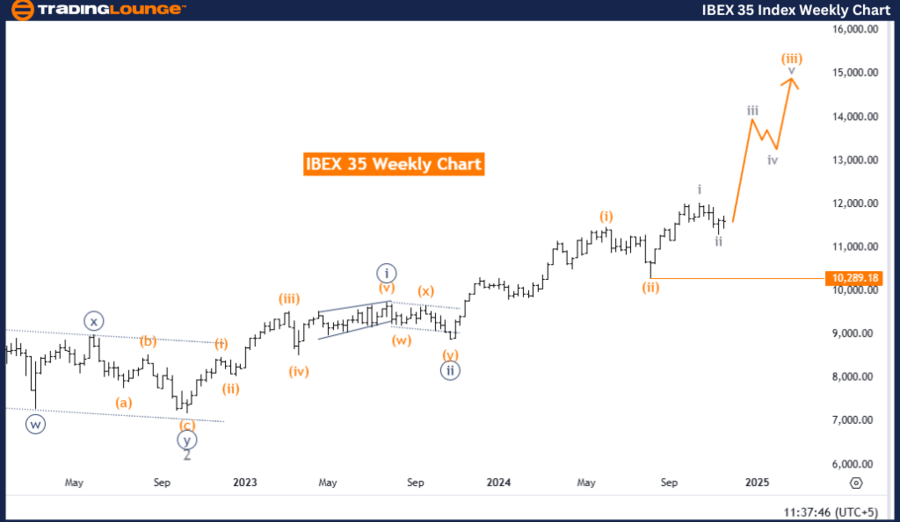
IBEX 35 (Spain) Elliott Wave Analysis Trading Lounge Weekly Chart
IBEX 35 (Spain) index Technical Analysis
Function: Bullish Trend
Mode: Impulsive
Structure: Orange wave 3
Position: Navy blue wave 3
Direction (Next Higher Degrees): Orange wave 3 (continue)
Details: Orange wave 2 appears completed; orange wave 3 of 3 is now in progress.
Wave Cancel Invalid Level: 10,289.18
The IBEX 35 weekly chart underscores a bullish trend as analyzed through the Elliott Wave framework. The current wave activity reflects an impulsive mode, emphasizing orange wave 3, which propels the ongoing upward trajectory. Within this context, the market has moved into navy blue wave 3, reinforcing the overall bullish movement.
Following the likely conclusion of orange wave 2, the market has transitioned into orange wave 3 of 3, signaling further upward progression. This phase highlights sustained bullish momentum supported by solid market dynamics.
The invalidation level for the weekly chart remains consistent at 10,289.18. A dip below this threshold would nullify the present wave count, requiring a fresh perspective on the market’s Elliott Wave configuration.
Key Takeaways:
- The bullish trend is led by orange wave 3 with strong upward momentum.
- The completion of orange wave 2 facilitates the unfolding of orange wave 3 of 3.
- An invalidation level at 10,289.18 is critical for confirming the wave analysis.
In conclusion, the IBEX 35 weekly chart supports a bullish outlook with orange wave 3 in an impulsive mode. The market's current trajectory aligns with strong upward momentum, offering valuable insights for long-term trading and investment strategies. Monitoring the invalidation level remains crucial for ensuring alignment with the Elliott Wave interpretation.
Technical Analyst: Malik Awais
Source: visit Tradinglounge.com and learn From the Experts Join TradingLounge Here
Previous: S&P BSE Sensex Elliott Wave Technical Analysis
VALUE Offer - Buy 1 Month & Get 3 Months!Click here
Access 7 Analysts Over 200 Markets Covered. Chat Room With Support