Silver Elliott Wave Analysis
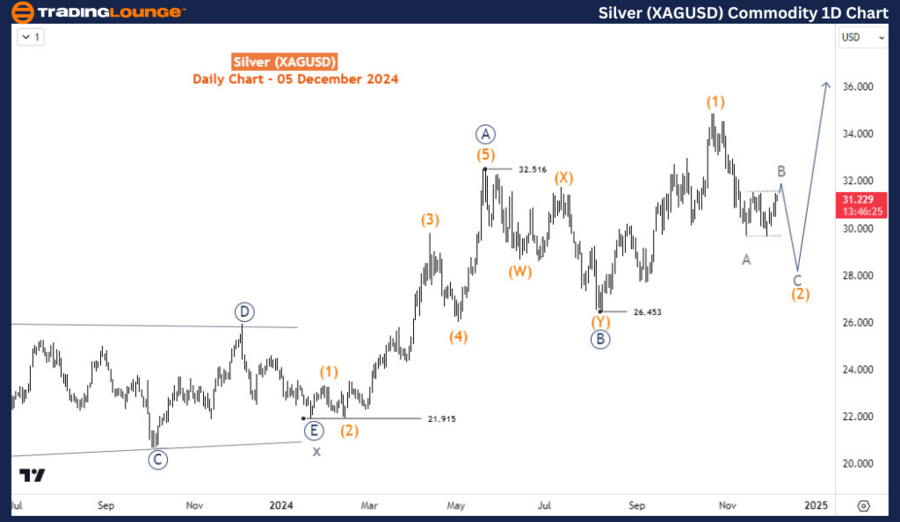
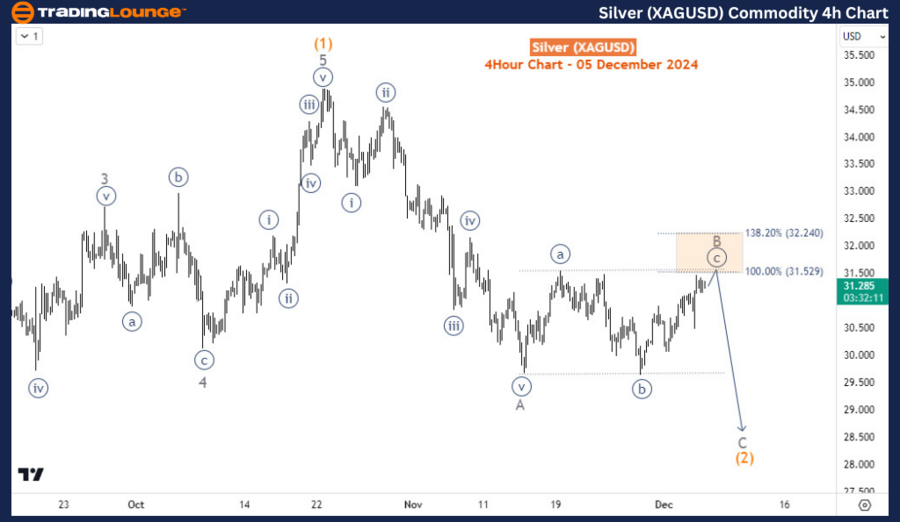
Silver has been rebounding since mid-November, albeit with reduced momentum. The sluggish rally suggests the downward pressure observed since October 23 might persist, potentially pushing Silver lower toward $28. However, the pullback from October 23 remains above the critical 26.45 pivot, indicating that the larger bullish sequence initiated in January 2024 is likely to continue.
Silver Daily Chart Analysis
The daily chart demonstrates a bullish trend for Silver in 2024. A 5-wave rally culminated at $32.5 in May 2024, starting from the $21.91 low in January 2024. This rally is labeled as wave ((A)), though it could also represent wave ((1)).
- If wave ((A)) is confirmed, Silver is unfolding into either a 5-wave or a 3-wave structure.
- The subsequent pullback to the $26.45 low on August 7 completed a corrective phase, potentially wave ((B)) or ((2)).
Based on projections:
- A resurgence from $26.45 could target $37.4–$44, representing either wave ((C)) or ((3)).
- Another 5-wave impulse rally emerged from $26.35, identified as wave (1) of ((C)) or (1) of ((3)). This rally was followed by the current pullback originating from October 2024’s peak.
The ongoing pullback aligns with wave (2) but seems incomplete, suggesting further price action before resuming the uptrend.

Silver H4 Chart Analysis
The H4 chart shows the price rebounding as part of wave B of (2). This bounce approaches a Fibonacci confluence resistance zone. Unless the rally surpasses $32.67, the downside is expected to persist short-term, completing wave (2). Afterward, Silver is projected to shift upward again to initiate wave (3), potentially driving the price toward the $40 level.
Technical Analyst: Sanmi Adeagbo
Source: visit Tradinglounge.com and learn From the Experts Join TradingLounge Here
See Previous: Gold (XAUUSD) Elliott Wave Technical Analysis
VALUE Offer - Buy 1 Month & Get 3 Months!Click here
Access 7 Analysts Over 200 Markets Covered. Chat Room With Support
