14Nov

Salesforce Inc. (CRM) Stocks Elliott Wave Technical Analysis: Salesforce Stock Forecast and Price Trends to $350

CRM Elliott Wave Analysis: Salesforce Inc. (CRM) Trends and Projections

This analysis delves into the trend structure of Salesforce Inc. (CRM) using the Elliott Wave Theory, evaluating both the daily and 1-hour charts. Below is a detailed breakdown of CRM’s current position and potential price movements.


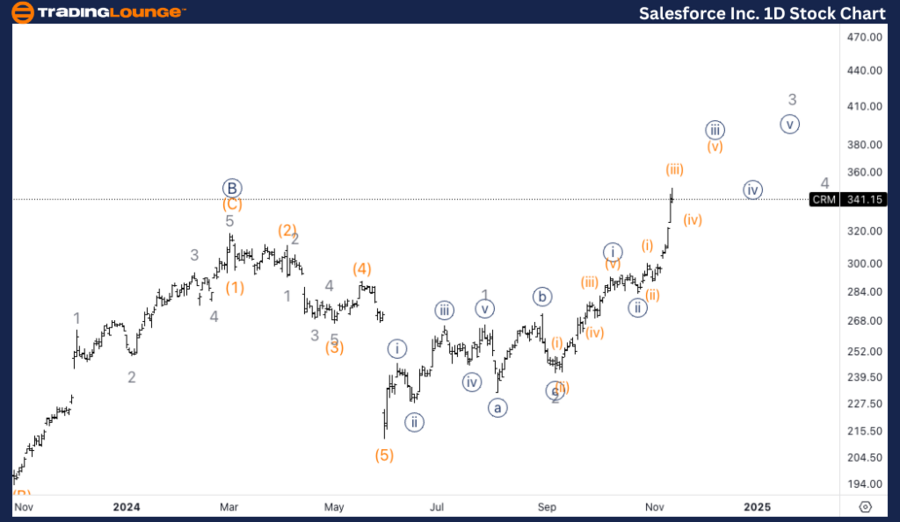
CRM Elliott Wave Analysis: TradingLounge Daily Chart

CRM Elliott Wave Technical Analysis

Function: Trend

Mode: Impulsive

Structure: Motive

Position: Minor 3

Direction: Upside within wave 3

Details:

Salesforce has entered a strong bullish phase, as evident in the impulsive structure heading towards all-time highs (ATH). Having surpassed the critical Trading Level 3 at $300, CRM has regained momentum and is pushing toward new peaks.

Key Observations on the Daily Chart:

CRM Elliott Wave Technical Analysis – Daily Chart On the daily chart, Salesforce appears to be in Minor wave 3, with a bullish impulsive structure developing. Having broken through the significant TradingLevel 3 at $300, the stock is now approaching all-time highs (ATH). This suggests that wave 3 has more room to the upside, and the structure is expected to continue unfolding towards new highs.

Salesforce-Inc-1D-St...


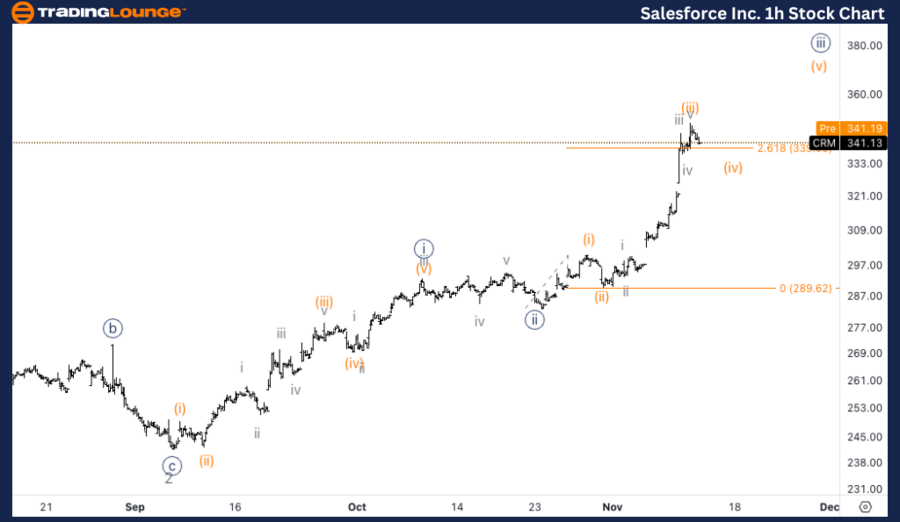
CRM Elliott Wave Analysis: TradingLounge 1-Hour Chart

CRM Elliott Wave Technical Analysis

Function: Trend

Mode: Impulsive

Structure: Motive

Position: Wave (iv) of {iii}

Direction: Bottom in wave (iv)

Details:

On the 1-hour chart, CRM is currently consolidating in wave (iv) of {iii}, following a strong rally in wave (iii). The price is near the 2.618 Fibonacci extension of wave (i), which may indicate that wave (iii) has reached a temporary peak.

Key Observations on the 1-Hour Chart:

CRM Elliott Wave Technical Analysis – 1H Chart On the 1-hour chart, CRM seems to be in wave (iv) of {iii}. There is a possibility that wave (iii) may have topped out, as the price is trading near the 2.618 Fibonacci extension of wave (i) vs. (iii). After wave (iv) completes, the focus will shift towards a potential move higher in wave (v), with $350 being a key resistance target for the completion of wave (v).

Technical Analyst: Alessio Barretta

Source: visit Tradinglounge.com and learn From the Experts Join TradingLounge Here 

See Previous: The Walt Disney Co. Elliott Wave Technical Analysis 

VALUE Offer - Buy 1 Month & Get 3 Months!Click here

Access 7 Analysts Over 200 Markets Covered. Chat Room With Support

Salesforce-Inc-1h-St...

Related

A Technical Breakdown: Bitcoin Crypto Price News Today Bitcoin/U.S. Dollar (BTCUSD) Elliott Wave Technical Analysis

A Technical Breakdown: Bitcoin Crypto Price News Today Bitcoin/U.S. Dollar (BTCUSD) Elliott Wave Technical Analysis

This article provides a detailed Elliott Wave Analysis of the Bitcoin/U.S. Dollar (BTCUSD) trading p...

Read More >
Learn about critical price levels and ASX market trends to enhance your trading confidence: ASX  LIMITED Elliott Wave Technical Forecast

Learn about critical price levels and ASX market trends to enhance your trading confidence: ASX LIMITED Elliott Wave Technical Forecast

Dive into a comprehensive Elliott Wave analysis of ASX Limited. Discover key insights, stock forecas...

Read More >
Exxon Mobil Inc. Stocks Elliott Wave Technical Analysis: Focusing XOM Stcok Market Behavior with chart Analysis

Exxon Mobil Inc. Stocks Elliott Wave Technical Analysis: Focusing XOM Stcok Market Behavior with chart Analysis

Discover our latest Elliott Wave analysis for Exxon Mobil Inc. (XOM) as of June 10, 2024. This compr...

Read More >
Polkadot / U.S. dollar(DOTUSD) Elliott Wave Technical Analysis 1 December 23

Polkadot / U.S. dollar(DOTUSD) Elliott Wave Technical Analysis 1 December 23

Polkadot / U.S. dollar(DOTUSD) Elliott Wave Technical Analysis dated 1 December 23, DOTUSD Crypto An...

Read More >
Elliott Wave Analysis of Palo Alto Networks (PANW) Stock with Insights into the Current Wave Structure and Price Movements

Elliott Wave Analysis of Palo Alto Networks (PANW) Stock with Insights into the Current Wave Structure and Price Movements

This article provides an Elliott Wave analysis of Palo Alto Networks (PANW) with insights into the c...

Read More >

Buy 1 Month

Get 3 Months!

Special Offer:

Trade Recommendations

Unleash the power of deversified trading with our comprehensive portfolio, covering:

  • Stock Trades
  • Crypto Trades
  • Forex Trades
  • Commodity Trades
Elliott Wave Analysis

Gain a competive edge with expert insights in to:

  • Global Indices
  • US Stocks & ASX Stocks
  • Forex & Crypto
  • Commodities
Top-Notch Trading Tools

Equip yourself with the tools of success:

  • Social Chat
  • Elliott Wave Algorithm
  • Screener
  • TradingLevels
  • Trading Game
7 Elliott Wave Analysts

Stay ahead of the market with daily charts and insightful videos
-Your secret to strategic trading!

JOIN HERE


Welcome to TradingLounge (ASIC A.R.No. 321187), specialists in trades, trading education and technical analysis, covering stocks, indices, commodities, forex and cryptocurrencies.

When you join TradingLounge you have access to everything we offer, including trade tools, educational content and a social platform to chat with like-minded investors.

Read more

@Copyright 2024 by tradinglounge.com

Contact Us

Australian no: 02 4787 6020

International no: +61 (2) 47876020

Pay with:

Find us on