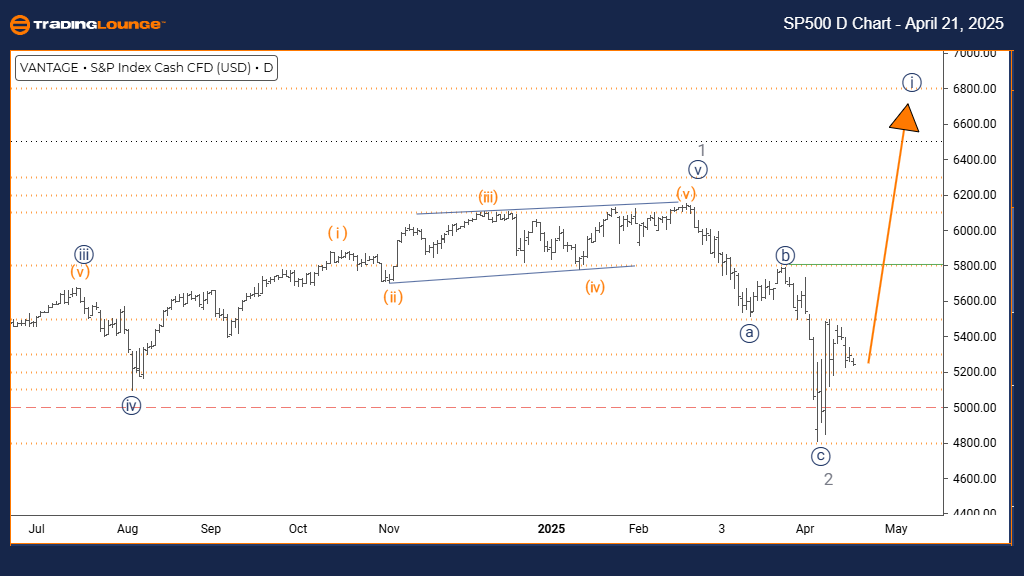
S&P 500 Elliott Wave Analysis – TradingLounge Daily Chart
S&P 500 Elliott Wave Technical Forecast – Daily Timeframe
FUNCTION: Trend
MODE: Impulsive
STRUCTURE: Navy Blue Wave 1
POSITION: Gray Wave 3
DIRECTION NEXT LOWER DEGREES: Navy Blue Wave 2
DETAILS: Gray wave 2 looks complete; navy blue wave 1 of 3 is currently developing.
The S&P 500 Elliott Wave analysis on the daily chart reveals an impulsive uptrend emerging after the completion of gray wave 2. The index is now in the early stages of navy blue wave 1, nested within the larger gray wave 3 structure. This setup indicates the beginning of a strong bullish cycle, offering traders an opportunity to align with a developing upward trend.
Navy blue wave 1 signals the launch of a new bullish sequence. Typically, this wave builds gradually with steady momentum as investor sentiment shifts. The completion of gray wave 2 has provided the foundation for this rally. While wave 1 movements are not always aggressive, they serve as a base for the broader impulsive advance expected in wave 3.
The current phase within gray wave 3 suggests potential for increased momentum ahead, making this an attractive setup for bullish strategies. Observing rising volume and price strength will help confirm the integrity of wave 1's progression. Technical traders should focus on trend-following opportunities as this impulsive structure unfolds.
The next expected development is navy blue wave 2, which should follow the completion of wave 1. This corrective phase may present a temporary dip—offering potential re-entry or add-on positions before the stronger wave 3 rally. Watch for signs of slowing momentum and support tests to anticipate the start of wave 2.
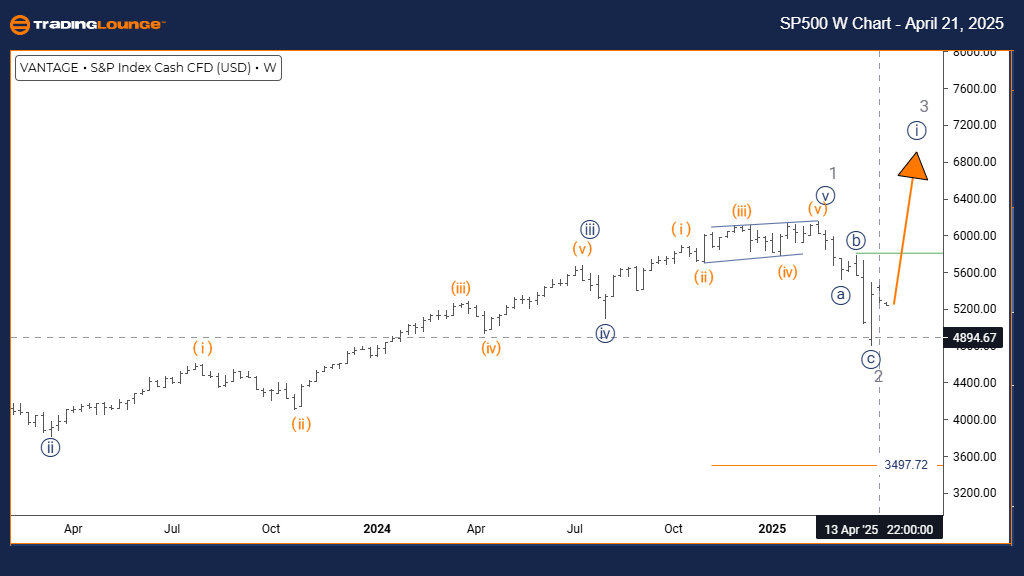
S&P 500 Elliott Wave Analysis – TradingLounge Weekly Chart
S&P 500 Elliott Wave Technical Forecast – Weekly Timeframe
FUNCTION: Trend
MODE: Impulsive
STRUCTURE: Navy Blue Wave 1
POSITION: Gray Wave 3
DIRECTION NEXT LOWER DEGREES: Navy Blue Wave 2
DETAILS: Gray wave 2 seems complete, with navy blue wave 1 of 3 actively unfolding.
The S&P 500 weekly Elliott Wave chart showcases the formation of a robust bullish pattern, rooted in an impulsive structure. With gray wave 2 concluded, the market has transitioned into navy blue wave 1—part of the larger degree gray wave 3. This signifies a likely medium-term uptrend with strong bullish implications.
Wave 1 typically introduces the trend, marked by increasing bullish sentiment and consistent upward movement. As navy blue wave 1 progresses, traders can expect growing confidence and positioning in line with the emerging trend. This phase lays the groundwork for more aggressive moves in the upcoming waves.
Being within the framework of gray wave 3, which is usually the strongest wave in the Elliott Wave sequence, adds weight to the bullish outlook. The current structure suggests the early stages of a sustained rally, making it ideal for medium- to long-term trend-following setups.
Following the completion of navy blue wave 1, a corrective wave 2 should emerge. This will likely provide a retracement opportunity before wave 3 resumes the upward momentum. Weekly analysis supports a bullish continuation, provided price and volume patterns align with the expected wave behavior.
Technical Analyst: Malik Awais
Source: Visit Tradinglounge.com and learn from the Experts. Join TradingLounge Here
Previous: S&P BSE SENSEX NEXT 50 Elliott Wave Technical Analysis
VALUE Offer - Buy 1 Month & Get 3 Months!Click here
Access 7 Analysts Over 200 Markets Covered. Chat Room With Support