10Jun

SEIUSD Elliott Wave Overview: Daily & H4 Chart Guide – Wave 2 Correction, $0.220 Breakout, Fibonacci Setup, Swing‑Trade Strategy

SEIUSD Elliott Wave Analysis | TradingLounge Daily Chart 

Sei/U.S. Dollar (SEIUSD) Daily Chart Analysis

SEIUSD Elliott Wave Technical Overview

Objective: Continuation of Bullish Trend

Wave Approach: Motive Wave Pattern

Wave Formation: Impulse Wave Setup

Current Market Phase: Corrective Wave 2

Next Move Forecast: Start of Higher Degree Impulse

Invalidation Threshold: Specified Below

SEIUSD Daily Trading Strategy

After completing a clean five-wave advance (①) around the $0.32 resistance level, SEI/USD entered a corrective A–B–C Zigzag pattern marking wave ②. This retracement is nearing a key Fibonacci zone, hinting that the downtrend may soon reverse.

Short-Term Trading Strategy

Tactical Setup: Designed for active swing traders

Entry Signal: A confirmed breakout above $0.220 signals the beginning of wave ③. Entry should be timed with upward price confirmation.

Risk Management: A price drop below $0.130 invalidates the current Elliott Wave outlook.

SEIUSD-day-Crypto-ch...


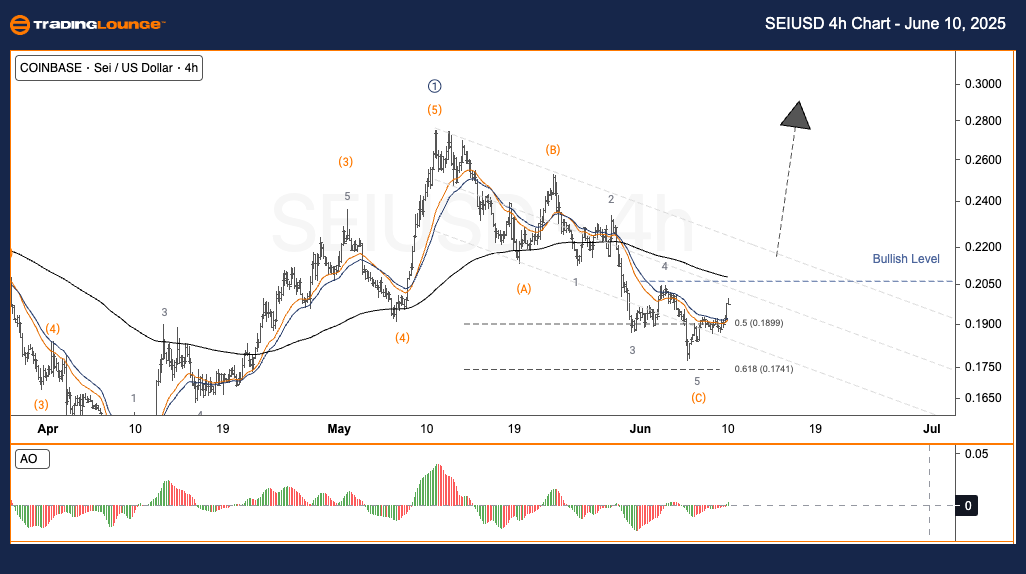
SEIUSD Elliott Wave Analysis | TradingLounge H4 Chart

Sei/U.S. Dollar (SEIUSD) 4-Hour Chart Analysis

SEIUSD Elliott Wave Technical Overview

Objective: Bullish Continuation Expected

Wave Structure: Motive Wave

Wave Pattern: Impulsive Move

Market Status: Currently in Wave 2

Anticipated Direction: Higher Wave Progression

Invalidation Point: Clearly Marked

SEIUSD H4 Trading Strategy

The SEI/USD chart has confirmed a five-wave structure (①) peaking close to $0.32. Presently, it's correcting in a typical A–B–C Zigzag formation, forming wave ②. This correction is stabilizing near a notable Fibonacci support level, increasing potential for bullish continuation.

Swing Trade Setup

  • Strategy Focus: Suitable for short-term and swing trades
  • Trigger Level: Watch for a breakout past $0.220 as validation of wave ③ start. Entry should follow confirmation signals.
  • Stop-Loss Guide: Any move below $0.130 invalidates the wave forecast.

Technical Analyst: Malik Awais

Source: Visit Tradinglounge.com and learn from the Experts. Join TradingLounge Here

Previous: DOTUSD Elliott Wave Technical Analysis

VALUE Offer - Buy 1 Month & Get 3 Months!Click here

Access 7 Analysts Over 200 Markets Covered. Chat Room With Support

SEIUSD-4h-Crypto-cha...

Related

Understand the Bullish Correction Phase: Natural Gas Commodity Elliottwave Technical Analysis

Understand the Bullish Correction Phase: Natural Gas Commodity Elliottwave Technical Analysis

Discover comprehensive insights into the Natural Gas market with our 2024 price forecast. This analy...

Read More >
Costco Wholesale Corp. (COST) Daily Chart Analysis Using Elliott Wave Theory - February 2nd, 2024

Costco Wholesale Corp. (COST) Daily Chart Analysis Using Elliott Wave Theory - February 2nd, 2024

Gain insights into COST Elliott Wave analysis for Costco Wholesale Corp. (COST) on February 24, 2024...

Read More >
Texas Instruments Inc. Stocks Analysis and Price Movements: TXN Elliott Wave Technical Analysis

Texas Instruments Inc. Stocks Analysis and Price Movements: TXN Elliott Wave Technical Analysis

Explore our in-depth Elliott Wave analysis of Texas Instruments Inc. (TXN). This analysis covers TXN...

Read More >
Cocoa Elliott Wave Technical Analysis: Unveiling Lucrative Trends

Cocoa Elliott Wave Technical Analysis: Unveiling Lucrative Trends

Cocoa's Elliott Wave Analysis reveals a resilient uptrend since September 2022, with prices surg...

Read More >
Expert Tips on Navigating the Market's Bullish and Bearish Signals: Bovespa Index Elliott Wave Technical Analysis

Expert Tips on Navigating the Market's Bullish and Bearish Signals: Bovespa Index Elliott Wave Technical Analysis

This article provides an in-depth Bovespa Index analysis, focusing on Elliott Wave strategies, marke...

Read More >
Discover the latest VanEck Semiconductor ETF (SMH) Stocks Elliott Wave Technical Analysis

Discover the latest VanEck Semiconductor ETF (SMH) Stocks Elliott Wave Technical Analysis

Discover the latest Elliott Wave analysis of the VanEck Semiconductor ETF (SMH) as of May 2024. This...

Read More >

$1 for 2 Weeks

then $29 a month!

What a Special Offer!

Trade Recommendations

Unleash the power of deversified trading with our comprehensive portfolio, covering 250+ markets:

  • Stock Trades
  • Crypto Trades
  • Forex Trades
  • Commodity Trades
Elliott Wave Analysis

Gain a competitive edge with expert insights and AI-powered Elliott Wave charting into:

  • Global Indices
  • US Stocks & ASX Stocks
  • Forex & Crypto
  • Commodities
Top-Notch Trading Tools

Equip yourself with the tools of success:

  • Real-time Chat rooms
  • Elliott Wave Algorithm
  • Portfolio tools
  • TradingLevels
  • Screener
  • Trading Game
7 Elliott Wave Analysts

Stay ahead of the market with daily charts and insightful videos
Your secret to strategic trading!

JOIN HERE


Welcome to TradingLounge (ASIC A.R.No. 321187), specialists in trades, trading education and technical analysis, covering stocks, indices, commodities, forex and cryptocurrencies.

When you join TradingLounge you have access to everything we offer, including trade tools, educational content and a social platform to chat with like-minded investors.

Read more

@Copyright 2024 by tradinglounge.com

Contact Us

Australian no: 02 4787 6020

International no: +61 (2) 47876020

Pay with:

Find us on