GOOGL Elliott Wave Analysis: Trading Opportunities Using Daily and 1-Hour Charts
In this Elliott Wave analysis of Alphabet Inc. (GOOGL), we will evaluate the stock's current price trends and highlight potential trading opportunities. By examining the daily and 1-hour charts, we aim to offer a clear outlook on GOOGL's market behavior.
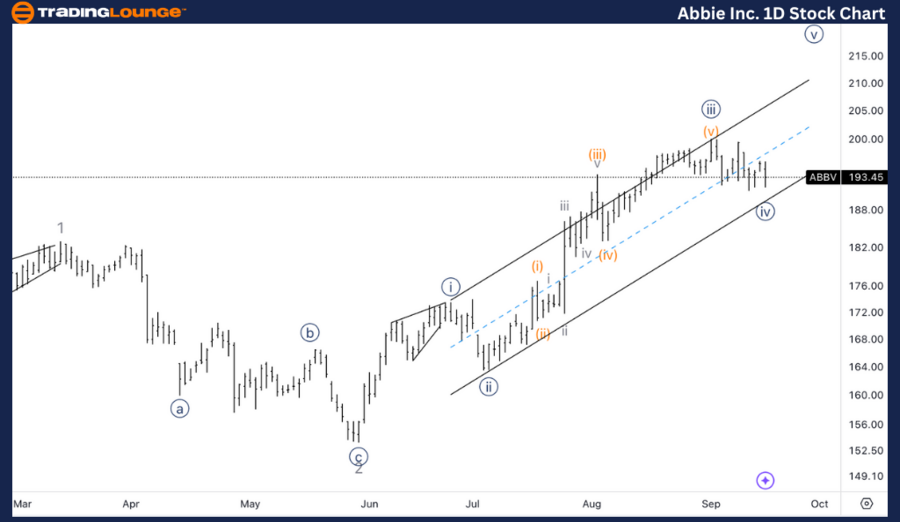
GOOGL Elliott Wave Analysis: Daily Chart
Alphabet Inc. (GOOGL) Daily Chart Overview
GOOGL Elliott Wave Technical Analysis
- Function: Trend
- Mode: Impulsive
- Structure: Motive
- Position: Minor Wave 1
- Direction: Subdivision in Wave 1
Details: As volume increases during the upward move, we expect a bottom to form in Wave (2). The next target is Minor Group 2, starting at $165.
GOOGL Elliott Wave Daily Chart Analysis
In the daily chart, Alphabet Inc. is progressing in an impulsive mode within Minor Wave 1 of a broader bullish structure. Recent price movements suggest that a potential bottom for Wave (2) has formed, supported by increasing volume on the rise. This indicates renewed buying interest, potentially signaling a continued bullish trend.
The next key target to monitor is Minor Group 2, starting at $165, which could act as a resistance zone or psychological barrier. If the stock sustains momentum within Wave 1 and breaks above this level, it would indicate further upside in the bullish trend.

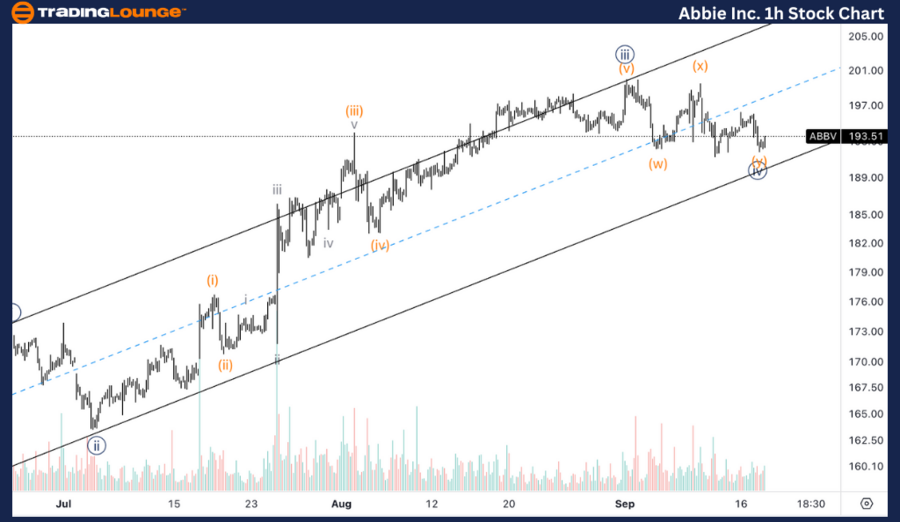
Alphabet Inc. (GOOGL) 1-Hour Chart Overview
GOOGL Elliott Wave Analysis: 1-Hour Chart
GOOGL Elliott Wave Technical Analysis
- Function: Trend
- Mode: Impulsive
- Structure: Motive
- Position: Minute Wave {i}
- Direction: Upside in Wave {i}
Details: We are observing what appears to be a clear five-wave move off the lows, which is projected to peak near the previous Wave B top.
GOOGL Elliott Wave 1-Hour Chart Analysis
On the 1-hour chart, GOOGL is advancing within Minute Wave {i}, which seems to be forming a distinct five-wave structure from recent lows. This development confirms the initiation of an impulsive move from the prior bottom. The target for this wave is near the previous Wave B top, serving as a crucial resistance level.
If the current five-wave move completes as anticipated, this would confirm the continuation of the bullish trend, with the potential for further gains in upcoming waves.
Technical Analyst: Alessio Barretta
Source: visit Tradinglounge.com and learn From the Experts Join TradingLounge Here
See Previous: Visa Inc. (V) Elliott Wave Technical Analysis
VALUE Offer - Buy 1 Month & Get 3 Months!Click here
Access 7 Analysts Over 200 Markets Covered. Chat Room With Support
