KOSPI Composite Elliott Wave Analysis Trading Lounge Day Chart
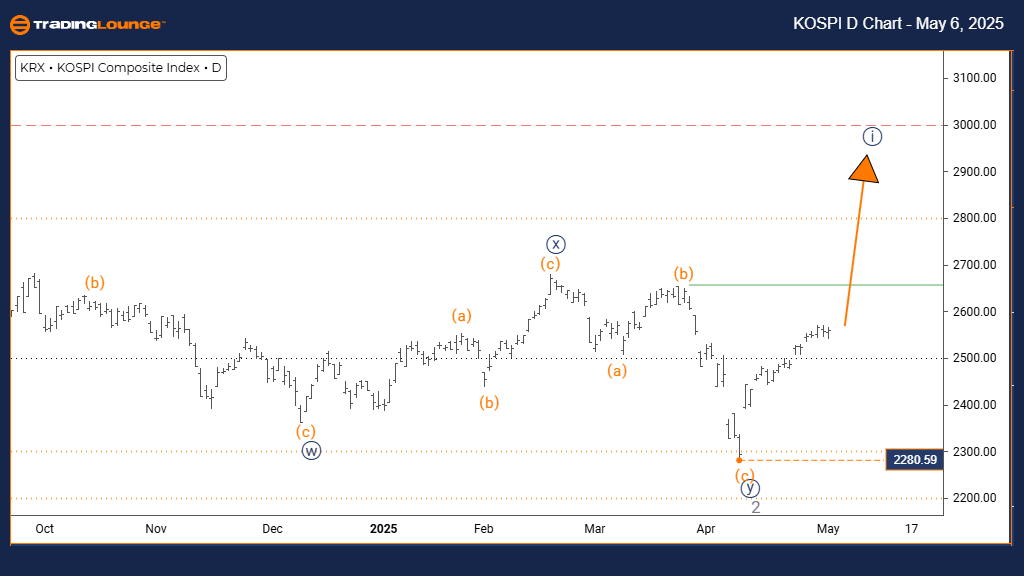
KOSPI Composite Index Day Chart Analysis
KOSPI Composite Wave Technical Analysis
FUNCTION: Trend
MODE: Impulsive
STRUCTURE: Navy blue wave 1
POSITION: Grey wave 3
DIRECTION NEXT HIGHER DEGREES: Navy blue wave 1 (initiated)
DETAILS: Gray wave 2 likely completed; navy blue wave 1 of 3 currently developing.
Wave Cancel Invalidation Level: 2280.59
The KOSPI Composite daily chart analysis shows a bullish Elliott Wave trend advancing within an impulsive structure. After completing gray wave 2, the index has initiated navy blue wave 1 inside the broader gray wave 3 formation. This setup highlights the early stages of a fresh impulse, suggesting upward momentum may continue strengthening in the near future.
The navy blue wave 1 marks the beginning of this impulsive move, usually featuring a steady rise as market conviction builds. Gray wave 2’s completion sets a base for navy blue wave 1, often resulting in controlled yet persistent price advances. The current Elliott Wave formation indicates continued growth potential before any notable corrective movement.
Critical support to monitor is 2280.59. A price drop below this level would invalidate the bullish outlook, demanding a reassessment of the Elliott Wave count. This invalidation level secures the low of gray wave 2.
Viewing the daily timeframe provides valuable insight into the emerging trend. Traders should track traditional wave traits like rising trading volume and gradual price gains, remembering that wave 1 often shows less intensity compared to wave 3.
Following the completion of navy blue wave 1, a corrective phase (navy blue wave 2) is expected. This retracement could offer a strategic entry before a powerful wave 3 rally. Monitoring price movements and momentum indicators will be crucial in confirming the Elliott Wave structure.
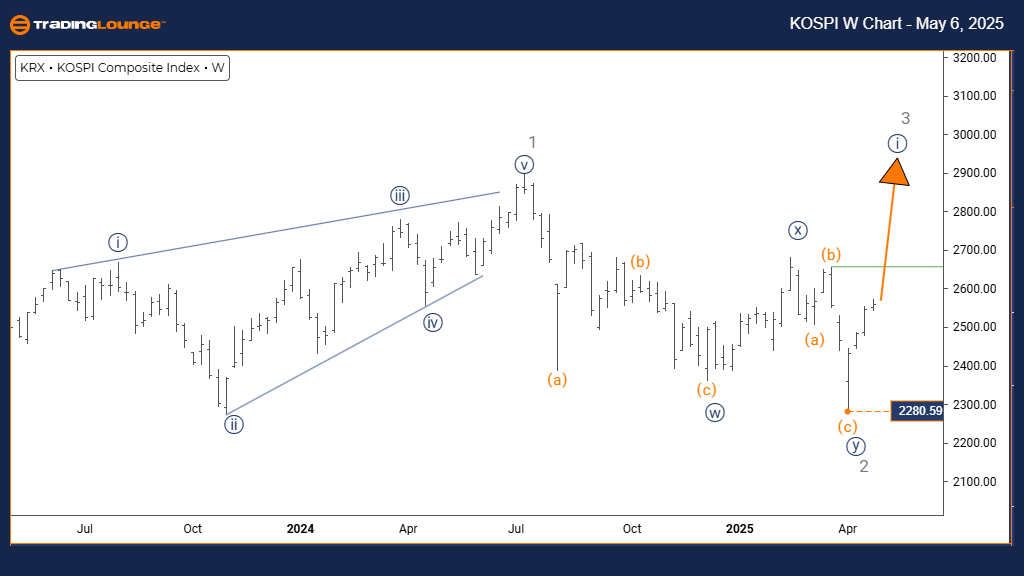
KOSPI Composite Elliott Wave Analysis Trading Lounge Weekly Chart
KOSPI Composite Wave Technical Analysis
FUNCTION: Trend
MODE: Impulsive
STRUCTURE: Navy blue wave 1
POSITION: Gray wave 3
DIRECTION NEXT HIGHER DEGREES: Navy blue wave 1 (initiated)
DETAILS: Gray wave 2 likely completed; navy blue wave 1 of 3 currently developing.
Wave Cancel Invalidation Level: 2280.59
The KOSPI Composite weekly chart analysis supports a bullish Elliott Wave trend building through an impulsive formation. Completion of gray wave 2 correction has transitioned the index into navy blue wave 1, part of the larger gray wave 3 structure. This early formation stage suggests increasing upside potential in the weeks and months ahead.
The navy blue wave 1 acts as the groundwork for this upward move, generally showing steady market progress as directional bias strengthens. Gray wave 2’s end marks the start of a progressive rally, even though wave 1 often grows slower compared to later stages like wave 3.
Key support remains at 2280.59. A break below this threshold would nullify the bullish Elliott Wave interpretation, leading to an updated analysis of the pattern.
The weekly view provides a broader confirmation of emerging bullish strength. Traders should monitor signals such as climbing volume and consistent price advancements, keeping in mind that wave 1 typically has a more moderate pace compared to wave 3.
After completing navy blue wave 1, the market is expected to correct into navy blue wave 2, presenting a retracement opportunity before the onset of a stronger wave 3 surge. Focus on tracking momentum indicators and price behavior will be key to validating the Elliott Wave progression.
Technical Analyst: Malik Awais
Source: Visit Tradinglounge.com and learn from the Experts. Join TradingLounge Here
Previous: Russell 2000 Elliott Wave Technical Analysis
VALUE Offer - Buy 1 Month & Get 3 Months!Click here
Access 7 Analysts Over 200 Markets Covered. Chat Room With Support