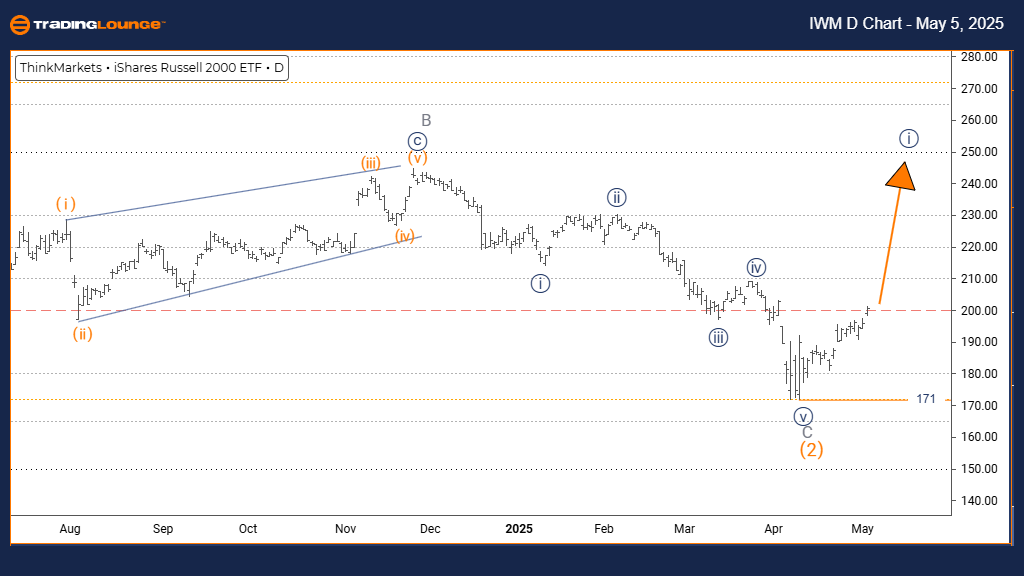
RUSSELL 2000 Elliott Wave Analysis - Trading Lounge Day Chart
RUSSELL 2000 Day Chart Analysis
RUSSELL 2000 Elliott Wave Technical Analysis
FUNCTION: Bullish Trend
MODE: Impulsive
STRUCTURE: Navy Blue Wave 1
POSITION: Gray Wave 1
DIRECTION NEXT LOWER DEGREES: Navy Blue Wave 2
DETAILS: Orange Wave 2 appears completed; Navy Blue Wave 1 of 1 is now progressing.
Wave Cancel Invalidation Level: 171
Daily Chart Analysis Overview
The RUSSELL 2000 daily Elliott Wave analysis highlights a bullish trend unfolding with an impulsive structure. The index has completed its Orange Wave 2 correction and has commenced Navy Blue Wave 1 within the broader Gray Wave 1 sequence. This phase represents the early development of a new impulse wave, indicating potential for continued upside in the sessions ahead.
Navy Blue Wave 1 initiates the new bullish cycle, typically marked by strengthening price action as market confidence grows. Following the Orange Wave 2 correction, Wave 1 often features consistent yet measured gains, setting the groundwork for a larger trend. Current trading patterns support the likelihood of a gradual but sustained climb until the next corrective phase.
Key Levels and Trading Strategy
The crucial invalidation point is at 171. A move below this level would nullify the bullish Elliott Wave count and trigger a reanalysis of the current market structure. Protecting the low of Wave 2, this level is key for managing risk in bullish setups.
On the daily timeframe, traders should observe key wave characteristics like improving volume trends and steady price rises. It’s important to note that while Wave 1 typically gains traction, it lacks the explosive momentum that is characteristic of Wave 3.
Next Steps and Market Outlook
Following the completion of Navy Blue Wave 1, the next anticipated move is a corrective Navy Blue Wave 2 pullback. This retracement could offer strategic buying opportunities ahead of a larger Wave 3 rally. Monitoring price action and momentum indicators closely will be critical for confirming the transition and preparing for potential bullish trades.
Technical signals will be vital as the RUSSELL 2000 progresses through its Gray Wave 1 phase, suggesting the potential for stronger momentum and significant upside in the weeks ahead.
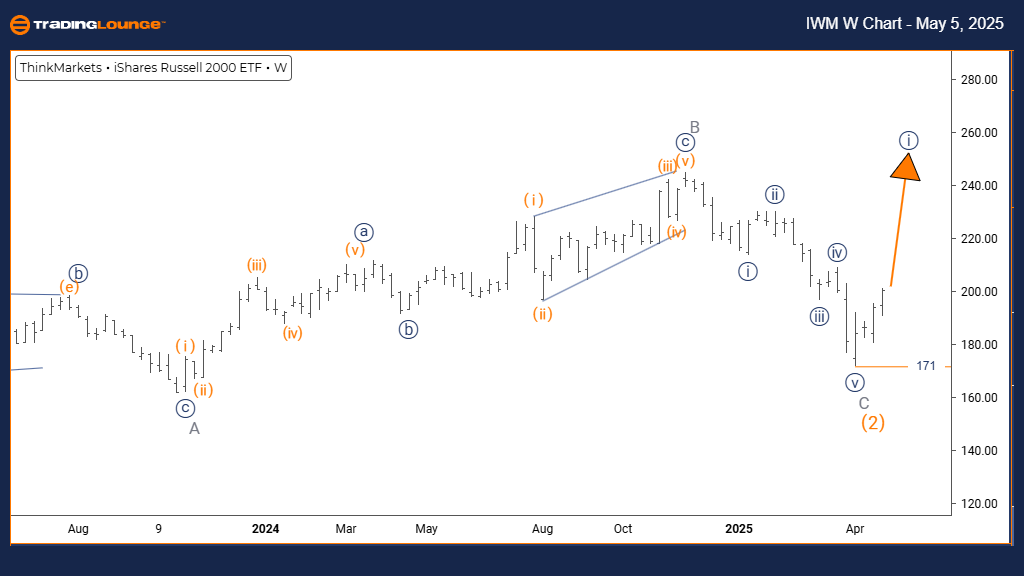
RUSSELL 2000 Elliott Wave Analysis - Trading Lounge Weekly Chart
RUSSELL 2000 Elliott Wave Technical Analysis
FUNCTION: Bullish Trend
MODE: Impulsive
STRUCTURE: Navy Blue Wave 1
POSITION: Gray Wave 1
DIRECTION NEXT LOWER DEGREES: Navy Blue Wave 2
DETAILS: Orange Wave 2 appears completed; Navy Blue Wave 1 of 1 is underway.
Wave Cancel Invalidation Level: 171
Weekly Chart Analysis Overview
The RUSSELL 2000 weekly Elliott Wave analysis reveals a bullish trend developing through an impulsive wave sequence. After completing the corrective Orange Wave 2, the index is advancing within Navy Blue Wave 1, positioned inside the broader Gray Wave 1 structure. This setup signals the initiation of what could be a significant upward move over the coming weeks.
Navy Blue Wave 1 establishes the foundation for this bullish cycle, typically showing steady price appreciation as the market's directional momentum strengthens. The post-Orange Wave 2 environment is ideal for the formation of a sustainable trend, with gradual price gains expected to build toward stronger phases in subsequent waves.
Market Structure and Key Levels
The evolving market structure points to the beginning of a substantial Gray Wave 1 trend, with Navy Blue Wave 1 as a sub-wave. This suggests an increasing probability of longer-term bullish momentum. Traders should monitor technical improvements such as rising volume and supportive indicator trends.
Upon completion of Navy Blue Wave 1, a corrective Navy Blue Wave 2 is anticipated, providing a natural consolidation before the next bullish extension. Price action and technical analysis will be essential for confirming this transition and validating the Elliott Wave count.
The 171 level remains critical. A break below this support would invalidate the bullish outlook and require a reassessment of the market's wave structure.
Trading Strategy and Outlook
The RUSSELL 2000 Elliott Wave forecast suggests preparing for bullish setups following the expected Wave 2 correction. Historically, Wave 3 offers the strongest gains within an impulsive structure, making this upcoming phase crucial for positioning within the larger trend. Traders should align strategies to capitalize on the emerging bullish momentum.
Technical Analyst: Malik Awais
Source: Visit Tradinglounge.com and learn from the Experts. Join TradingLounge Here
Previous: S&P/TSX 60 Elliott Wave Technical Analysis
VALUE Offer - Buy 1 Month & Get 3 Months!Click here
Access 7 Analysts Over 200 Markets Covered. Chat Room With Support