06Mar

ASX: Newmont Corporation (NEM) Elliott Wave Technical Analysis, Stock Forecast, Price Targets and Trading Strategy for Informed Decisions

ASX: NEWMONT CORPORATION (NEM) Elliott Wave Technical Analysis - TradingLounge

Greetings,

Today's Elliott Wave analysis focuses on Newmont Corporation (NEM) listed on the Australian Stock Exchange (ASX). The stock is currently in the final phase of a corrective wave, which could create a potential bullish trading opportunity for those monitoring ASX:NEM.


ASX: NEWMONT CORPORATION (NEM) Elliott Wave Technical Analysis

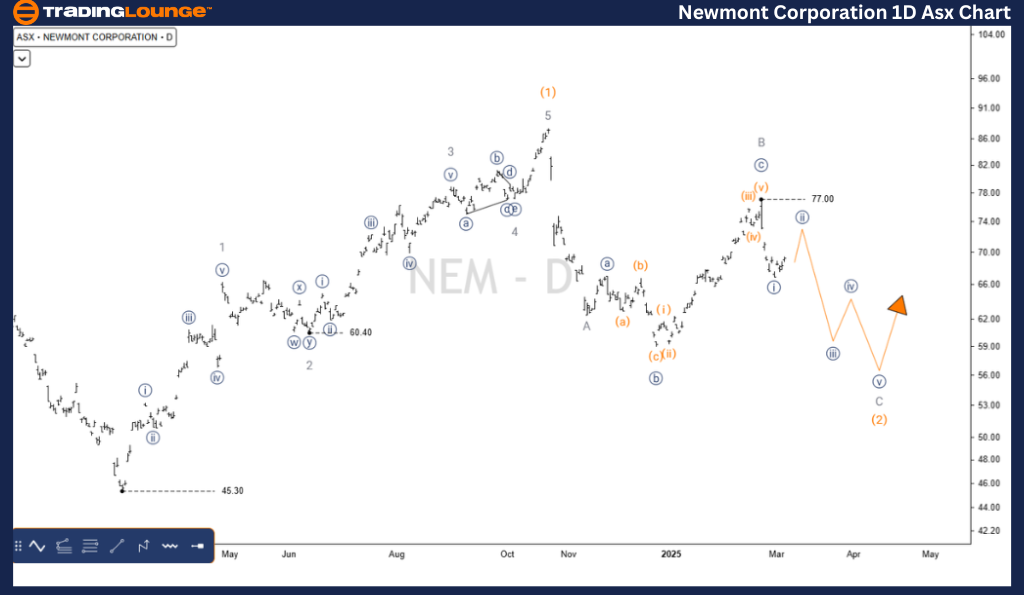
1D Chart (Semilog Scale) Analysis

Function: Major Trend (Intermediate Degree, Orange)

Mode: Motive

Structure: Impulse

Position: Wave C (Grey) of Wave (2) - Orange

Details:

  • The Elliott Wave count has been refined to improve accuracy.
  • Wave (2) - Orange continues its Zigzag formation (A-B-C, Grey), potentially extending longer than expected.
  • Wave B - Grey has recently concluded, with Wave C - Grey now trending downward, potentially reaching lower support levels.
  • Key Invalidation Point: 77.00

NEWMONT-CORPORATION-...


ASX: NEWMONT CORPORATION (NEM) Elliott Wave Technical Analysis - TradingLounge

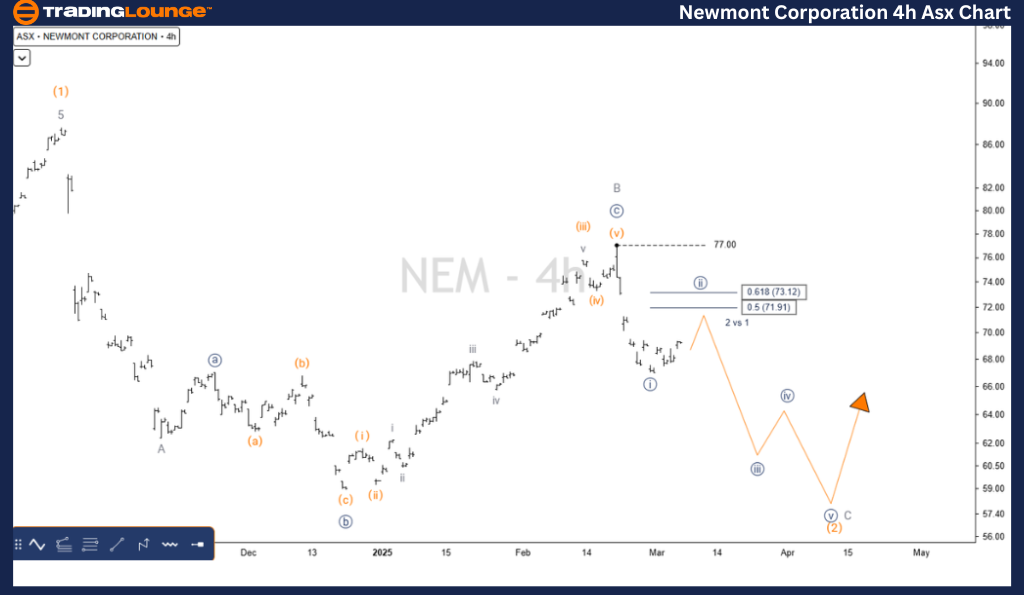
4-Hour Chart Analysis

Function: Major Trend (Minor Degree, Grey)

Mode: Motive

Structure: Impulse

Position: Wave ((ii)) (Navy) of Wave C - Grey of Wave (2) - Orange

Details:

  • Since 77.00, Wave C - Grey has been forming a Five-Wave pattern on the downside.
  • Wave ((i)) - Navy appears to be completed.
  • Wave ((ii)) - Navy is now retracing higher, targeting the 0.5 - 0.618 Fibonacci levels.
  • Once this retracement is completed, Wave ((iii)) - Navy is expected to resume its downward move.
  • Key Invalidation Point: 70.00

Technical Analyst: Hua (Shane) Cuong, CEWA-M (Master’s Designation).

Source: visit Tradinglounge.com and learn From the Experts Join TradingLounge Here 

See Previous: MACQUARIE GROUP LIMITED MQG Elliott Wave Technical Analysis

VALUE Offer - Buy 1 Month & Get 3 Months!Click here

Access 7 Analysts Over 200 Markets Covered. Chat Room With Support

NEWMONT-CORPORATION-...


Conclusion

Our Elliott Wave analysis for ASX: NEWMONT CORPORATION (NEM) provides key insights into current market trends and potential trading opportunities. By identifying critical price levels and validation/invalidation points, traders can enhance their confidence in the wave structure projections. This analysis delivers a data-driven and professional outlook on price movements, ensuring an objective perspective on ASX:NEM trading strategies.

Related

U.S. Dollar / Swiss Franc Forex Technical Analysis | USDCHF Elliott Wave Analysis: Day and 4-Hour Chart Forecast for Traders

U.S. Dollar / Swiss Franc Forex Technical Analysis | USDCHF Elliott Wave Analysis: Day and 4-Hour Chart Forecast for Traders

This post provides a comprehensive USDCHF Elliott Wave analysis, including insights from day and 4-h...

Read More >
GX Uranium ETF (URA) Commodity Elliott Wave Technical Analysis: Navigating Market Corrections

GX Uranium ETF (URA) Commodity Elliott Wave Technical Analysis: Navigating Market Corrections

This detailed analysis of the GX Uranium ETF (URA) using Elliott Wave theory provides an in-depth lo...

Read More >
Iron Ore Commodity Elliott Wave Technical Analysis: Market Trends and Price Outlook for 2024

Iron Ore Commodity Elliott Wave Technical Analysis: Market Trends and Price Outlook for 2024

The SGX TSI Iron Ore Index has become an essential benchmark for market participants in iron ore tra...

Read More >
Navigate XRP Downtrends and Prepare for uptrends using the MA200: XRP Crypto Price and XRPUSD Elliott Wave Technical Analysis

Navigate XRP Downtrends and Prepare for uptrends using the MA200: XRP Crypto Price and XRPUSD Elliott Wave Technical Analysis

This comprehensive guide covers XRPUSD Elliott Wave analysis and trading strategy. It includes Rippl...

Read More >
Enhance your Forex Trading Strategies With New Zealand Dollar/U.S. Dollar (NZDUSD) Forex Elliott Wave Technical Analysis

Enhance your Forex Trading Strategies With New Zealand Dollar/U.S. Dollar (NZDUSD) Forex Elliott Wave Technical Analysis

Our detailed Elliott Wave analysis gives a comprehensive understanding of the NZDUSD currency pair. ...

Read More >
S&P 500 ELLIOTT WAVE ANALYSIS, 20 JAN 2022

S&P 500 ELLIOTT WAVE ANALYSIS, 20 JAN 2022

S&P500 Expect support at 4500, but eventually expect the market to move through this Minor Level and...

Read More >

Buy 1 Month

Get 3 Months!

Special Offer:

Trade Recommendations

Unleash the power of deversified trading with our comprehensive portfolio, covering:

  • Stock Trades
  • Crypto Trades
  • Forex Trades
  • Commodity Trades
Elliott Wave Analysis

Gain a competive edge with expert insights in to:

  • Global Indices
  • US Stocks & ASX Stocks
  • Forex & Crypto
  • Commodities
Top-Notch Trading Tools

Equip yourself with the tools of success:

  • Social Chat
  • Elliott Wave Algorithm
  • Screener
  • TradingLevels
  • Trading Game
7 Elliott Wave Analysts

Stay ahead of the market with daily charts and insightful videos
-Your secret to strategic trading!

JOIN HERE


Welcome to TradingLounge (ASIC A.R.No. 321187), specialists in trades, trading education and technical analysis, covering stocks, indices, commodities, forex and cryptocurrencies.

When you join TradingLounge you have access to everything we offer, including trade tools, educational content and a social platform to chat with like-minded investors.

Read more

@Copyright 2024 by tradinglounge.com

Contact Us

Australian no: 02 4787 6020

International no: +61 (2) 47876020

Pay with:

Find us on