03Apr

U.S. Dollar / Japanese Yen (USDJPY) Elliott Wave Forecast: Technical Analysis with Daily and 4-Hour Chart Insights, Wave Structure, and Trading Outlook

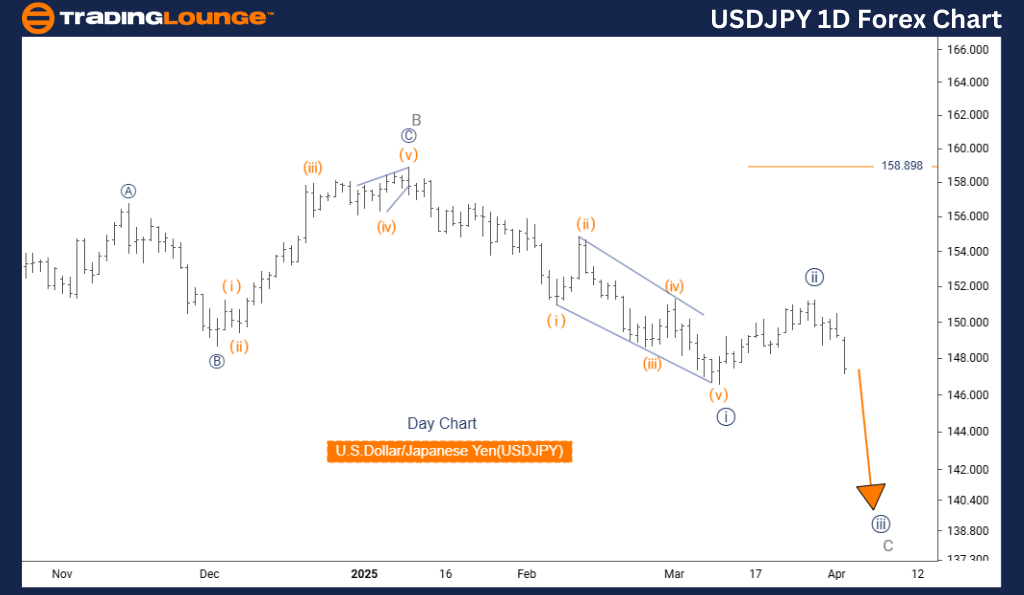
U.S. Dollar / Japanese Yen (USDJPY) Elliott Wave Analysis – TradingLounge Daily Chart

USDJPY Elliott Wave Technical Review

Function: Counter Trend

Mode: Impulsive

Structure: Navy Blue Wave 3

Position: Gray Wave C

Next Higher Degree Direction: Navy Blue Wave 4

Invalidation Level: 158.898

Analysis Summary
The daily Elliott Wave forecast for USDJPY signals a counter-trend structure that carries major implications for medium-term price action. The current focus is on the development of navy blue wave 3 within gray wave C.

Following the completion of navy blue wave 2, the USDJPY currency pair has begun the impulsive stage of navy blue wave 3. This segment plays a central role in the ongoing corrective pattern and offers trading opportunities for trend-based strategies.

Technical Assessment
Should the price fall below the invalidation level of 158.898, the existing wave structure would be invalidated. So long as the price holds above this level, the forecast remains consistent with a developing impulsive move within a corrective framework.

Once navy blue wave 3 concludes, traders should prepare for navy blue wave 4, which is expected to introduce a correction phase. Monitoring the momentum and structure of wave 3 is essential, as these are often indicative of market sentiment shifts.

Trading Outlook
This Elliott Wave analysis provides a useful framework for short-term trade setups and long-term market positioning. It's essential to keep an eye on the interaction between wave degrees and the broader market context to make informed trading decisions.

usdjpy-1d-forex-char...


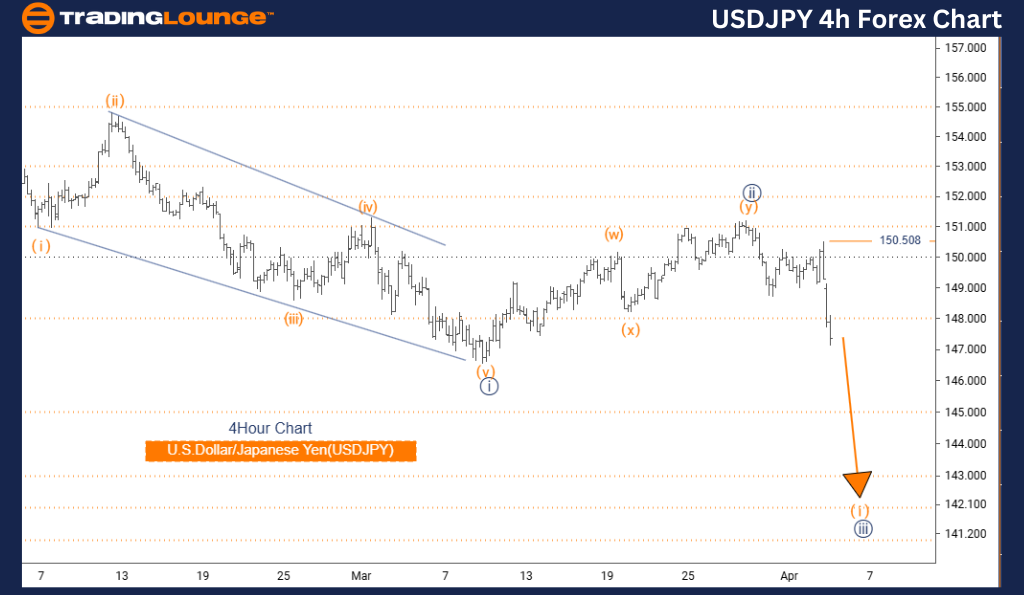
U.S. Dollar / Japanese Yen (USDJPY) Elliott Wave Analysis – TradingLounge 4-Hour Chart

USDJPY Elliott Wave Technical Review

Function: Bearish Trend

Mode: Impulsive

Structure: Orange Wave 1

Position: Navy Blue Wave 3

Next Higher Degree Direction: Orange Wave 2

Invalidation Level: 150.508

Analysis Summary
The 4-hour USDJPY Elliott Wave chart reveals a developing bearish trend with potential for momentum expansion. The structure of orange wave 1 currently dominates the setup and is part of the broader navy blue wave 3 sequence.

Navy blue wave 2 has likely ended, and the pair now appears to be entering orange wave 1 of 3, suggesting a possible continuation of downward movement.

Technical Assessment
The key invalidation level to watch is 150.508. A breach of this point would challenge the current wave count. Maintaining price action below this level supports the forecast of further downside potential.

Once orange wave 1 concludes, a short-term correction in the form of orange wave 2 is anticipated, likely preceding the resumption of bearish action in orange wave 3.

Trading Outlook
This Elliott Wave setup offers both intraday and swing trading opportunities. The progression of orange wave 1 presents a window for early short positions aligned with the growing bearish momentum. Traders should look for confirming signals such as sharp price moves and rising volume.

Effective risk management, particularly near the invalidation level, is vital to navigate potential volatility.

Technical Analyst: Malik Awais

Source: Visit Tradinglounge.com and learn from the Experts Join TradingLounge Here 

Previous: EURUSD Elliott Wave Technical Analysis

VALUE Offer - Buy 1 Month & Get 3 Months!Click here

Access 7 Analysts Over 200 Markets Covered. Chat Room With Support

usdjpy-4h-forex-char...

Related

ASX Northern Star Resources Ltd (NST) Elliott Wave Technical Analysis: Stock Forecast and Key Price Targets for Bullish Trends

ASX Northern Star Resources Ltd (NST) Elliott Wave Technical Analysis: Stock Forecast and Key Price Targets for Bullish Trends

Elliott Wave analysis for ASX: Northern Star Resources Ltd (NST), focusing on bullish trends, key pr...

Read More >
ASX: BRK.B Elliott Wave Analysis Provides a Detailed Technical Outlook on Berkshire Hathaway Stock Using Daily and 1-hour Charts

ASX: BRK.B Elliott Wave Analysis Provides a Detailed Technical Outlook on Berkshire Hathaway Stock Using Daily and 1-hour Charts

This BRK.B Elliott Wave analysis provides a detailed technical outlook on Berkshire Hathaway stock u...

Read More >
URW Elliott Wave Analysis for ASX Stock Unibail Rodamco Westfield Provides Critical Insights into Potential Stock Price Movements

URW Elliott Wave Analysis for ASX Stock Unibail Rodamco Westfield Provides Critical Insights into Potential Stock Price Movements

Our latest Elliott Wave analysis for ASX UNIBAIL-RODAMCO-WESTFIELD (URW) provides critical insights ...

Read More >
Microsoft Inc.(MSFT) Stocks Elliott Wave Technical Analysis: Navigating Through Corrective Patterns

Microsoft Inc.(MSFT) Stocks Elliott Wave Technical Analysis: Navigating Through Corrective Patterns

Our report on Elliott Wave analysis of Microsoft Inc. (MSFT) offers valuable guidance for traders na...

Read More >
VanEck Rare Earth & Strategic Metals ETF (REMX) Elliott Wave Analysis: Zigzag Pattern, and ETF Trading Strategy Insights

VanEck Rare Earth & Strategic Metals ETF (REMX) Elliott Wave Analysis: Zigzag Pattern, and ETF Trading Strategy Insights

VanEck Rare Earth & Strategic Metals ETF (REMX), focusing on the wave 4 correction within a zigzag s...

Read More >
Northern Star Resources NST Elliott Wave Technical Analysis to Help Guide Your Investment Decisions in the ASX Market

Northern Star Resources NST Elliott Wave Technical Analysis to Help Guide Your Investment Decisions in the ASX Market

Our detailed Elliott Wave analysis of Northern Star Resources (NST.ASX) highlights current market tr...

Read More >

$1 for 2 Weeks

then $29 a month!

What a Special Offer!

Trade Recommendations

Unleash the power of deversified trading with our comprehensive portfolio, covering 250+ markets:

  • Stock Trades
  • Crypto Trades
  • Forex Trades
  • Commodity Trades
Elliott Wave Analysis

Gain a competitive edge with expert insights and AI-powered Elliott Wave charting into:

  • Global Indices
  • US Stocks & ASX Stocks
  • Forex & Crypto
  • Commodities
Top-Notch Trading Tools

Equip yourself with the tools of success:

  • Real-time Chat rooms
  • Elliott Wave Algorithm
  • Portfolio tools
  • TradingLevels
  • Screener
  • Trading Game
7 Elliott Wave Analysts

Stay ahead of the market with daily charts and insightful videos
Your secret to strategic trading!

JOIN HERE


Welcome to TradingLounge (ASIC A.R.No. 321187), specialists in trades, trading education and technical analysis, covering stocks, indices, commodities, forex and cryptocurrencies.

When you join TradingLounge you have access to everything we offer, including trade tools, educational content and a social platform to chat with like-minded investors.

Read more

@Copyright 2024 by tradinglounge.com

Contact Us

Australian no: 02 4787 6020

International no: +61 (2) 47876020

Pay with:

Find us on