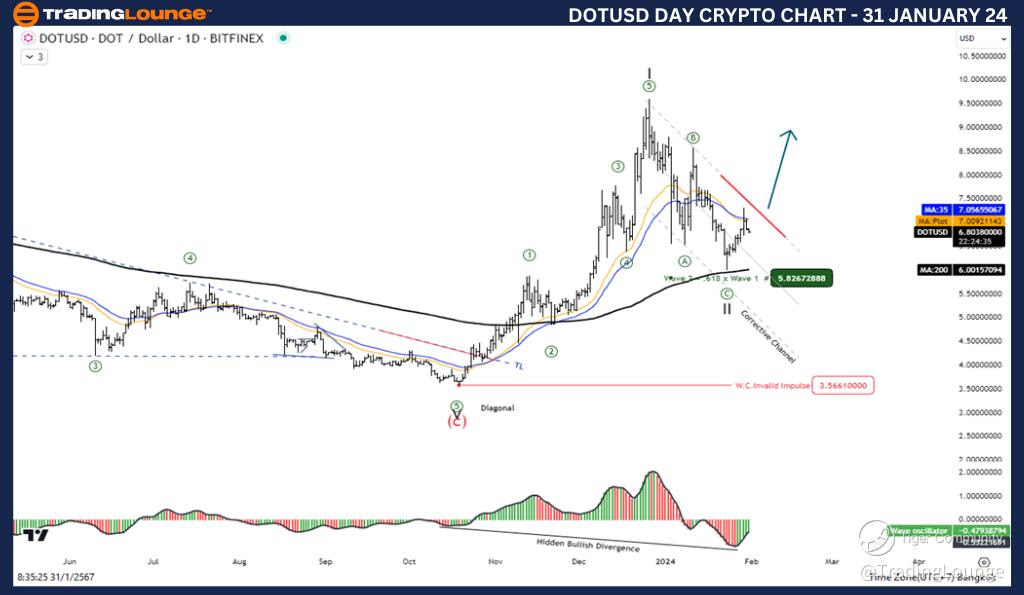
Elliott Wave Analysis TradingLounge Daily Chart, 31 January 24,
Polkadot technical analysis today
Polkadot / U.S. dollar(DOTUSD)
DOTUSD Elliott Wave Technical Analysis
Function: Counter Trend
Mode: Corrective
Structure: Zigzag
Position: Wave C
Direction Next higher Degrees: wave (II) of Impulse
Wave Cancel invalid level: 3.566
Details: Wave (II) maybe is complete at 5.992 level and the price increase again in Wave (III)
Polkadot / U.S. dollar(DOTUSD)Trading Strategy: Wave II correction appears to have ended at the 5.992 level and prices are entering an uptrend in Wave III, looking for an entry opportunity. Join the trend again in an upward direction.
Polkadot / U.S. dollar(DOTUSD)Technical Indicators: The price is Above the MA200 indicating an uptrend, Wave Oscillators a bullish Momentum.
TradingLounge Analyst: Kittiampon Somboonsod, CEWA
Source: Tradinglounge.com, Learn From the Experts Join TradingLounge Here
Previous: NEO / U.S. dollar(NEOUSD)

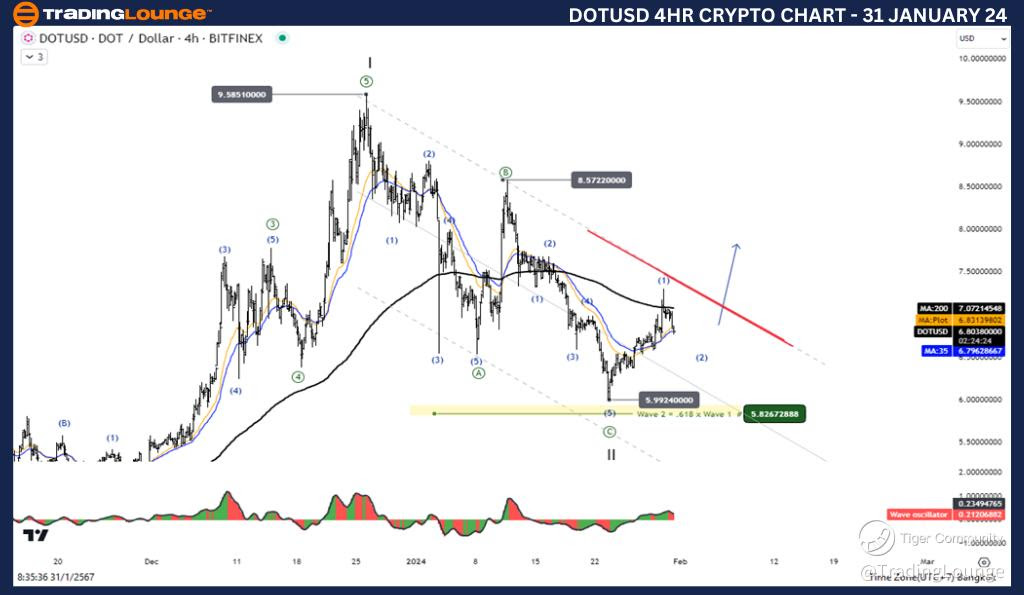
Elliott Wave Analysis TradingLounge 4Hr Chart, 31 January 24,
Polkadot/U.S. dollar(DOTUSD)
DOTUSD Elliott Wave Technical Analysis
Function: Counter Trend
Mode: Corrective
Structure: Zigzag
Position: Wave C
Direction Next higher Degrees: wave (II) of Impulse
Wave Cancel invalid level: 3.566
Details: Wave (II) maybe is complete at 5.992 level and the price increase again in Wave (III)
Polkadot / U.S. dollar(DOTUSD) Trading Strategy: Wave II correction appears to have ended at the 5.992 level and prices are entering an uptrend in Wave III, looking for an entry opportunity. Join the trend again in an upward direction.
Polkadot / U.S. dollar(DOTUSD) Technical Indicators: The price is below the MA200 indicating a downtrend, Wave Oscillators a bearish Momentum.
